Access Grafana and Prometheus
By default, the Grafana and Prometheus instances bundled with Excalibur are not exposed externally. They are reachable only from inside the cluster. This is a deliberate security posture — observability tooling holds detailed operational telemetry and must not be available to unauthenticated users on the public internet.
This page describes the supported ways to reach Grafana and Prometheus.
Prerequisites
- You have
kubectlaccess to the Excalibur namespace. - You can reach the Kubernetes API server from your workstation.
- You have credentials to log in to Grafana once you reach it.
Default State
Out of the box:
- The
grafanaServiceis reachable only inside the cluster atgrafana:3000(orgrafana.<namespace>.svc.cluster.local:3000from other namespaces). - The
prometheusServiceis reachable only inside the cluster atprometheus:9090. - Neither service is published through the
proxyIngress. - Browsing to
https://<excalibur-hostname>/adminreturns HTTP 404 (not exposed).
To open the dashboards, choose one of the methods below.
| Method | When to use | Exposes Grafana publicly? |
|---|---|---|
Port-forward from kubectl |
Recommended for day-to-day operator access. | No |
| Maintenance mode | Short, controlled access during planned maintenance windows. | Temporarily, behind authentication |
| Helm-chart exposure | Permanent exposure for environments that require it (rare). | Yes |
Port-Forward Access (Recommended)
A kubectl port-forward tunnel makes Grafana available at http://localhost:3000 on your workstation. Only operators with cluster credentials can use this method, and the tunnel terminates as soon as you stop the command.
Procedure
-
Confirm the
grafanapod isRunning:kubectl get pods -n <namespace> -l app=grafanaExpected output:
NAME READY STATUS RESTARTS AGE grafana-<hash> 1/1 Running 0 <age> -
Open a port-forward tunnel from your workstation to the in-cluster
grafanaService:kubectl port-forward -n <namespace> svc/grafana 3000:3000Expected output:
Forwarding from 127.0.0.1:3000 -> 3000 Forwarding from [::1]:3000 -> 3000 -
Open
http://localhost:3000in your browser and sign in with your Grafana credentials.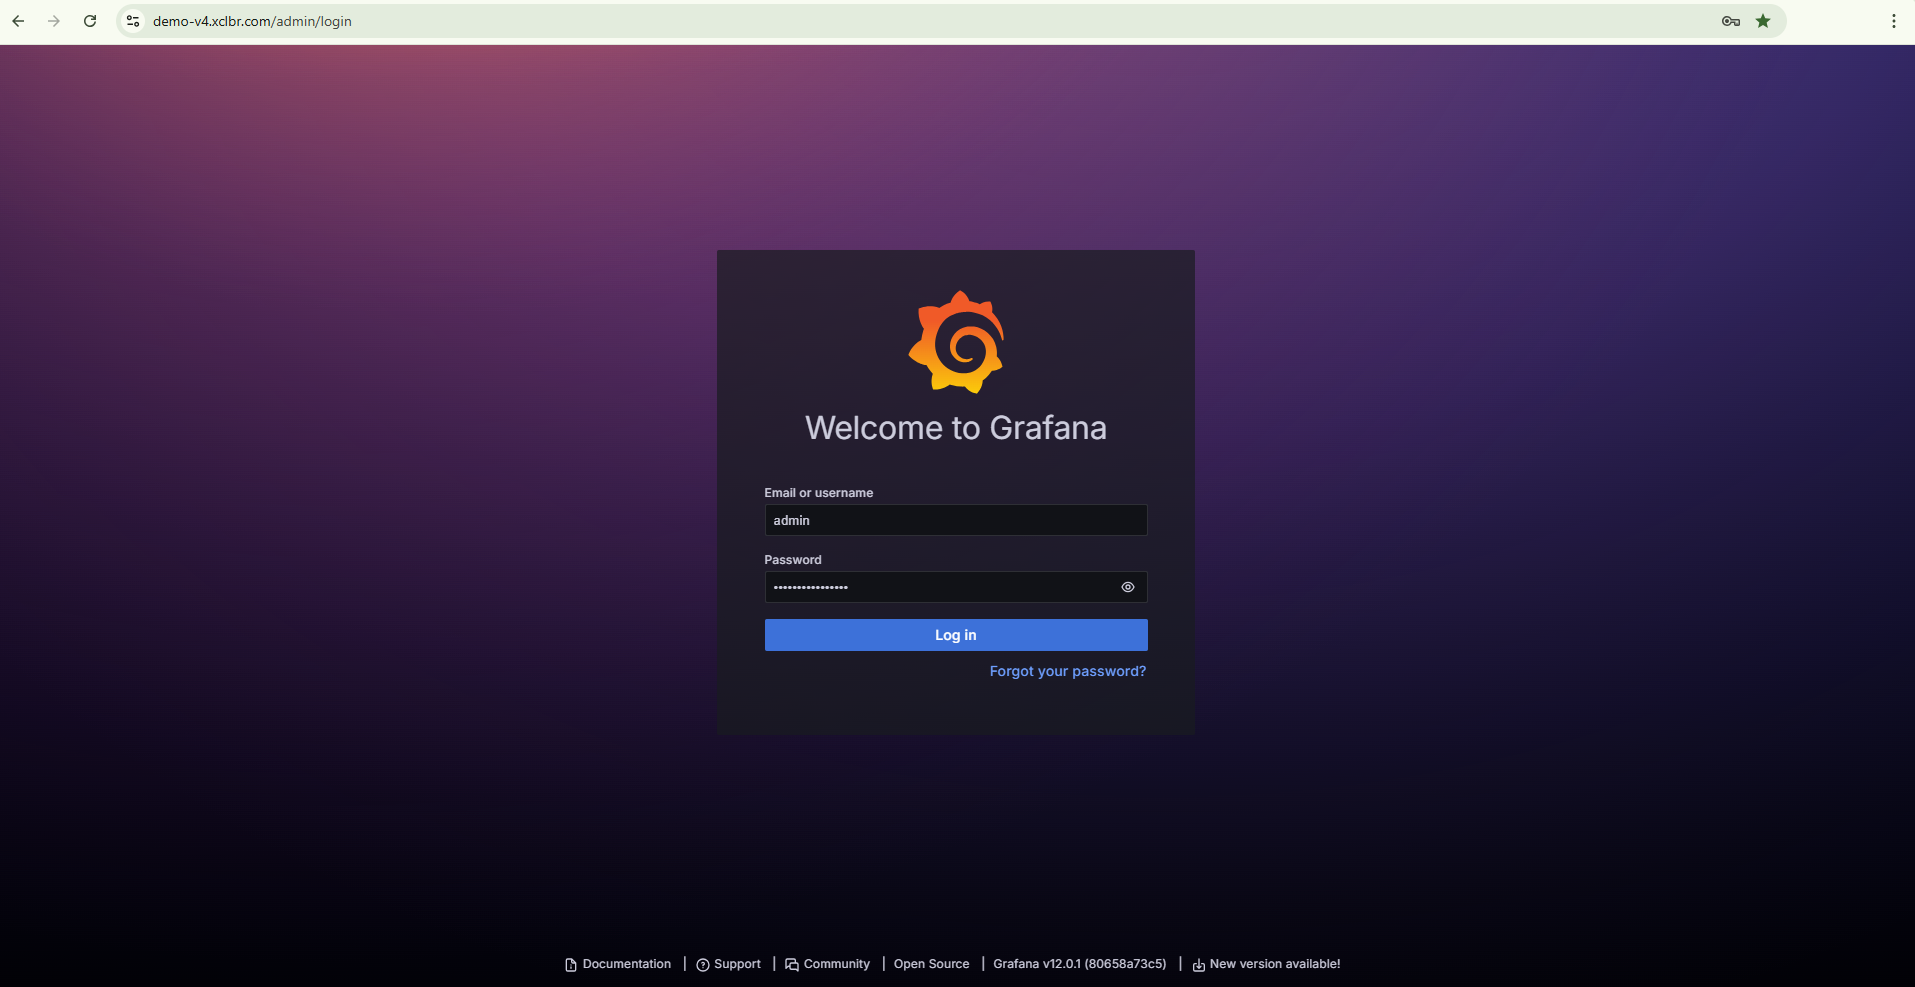
Figure 1. Grafana login page reached through port-forward.
-
When finished, stop the port-forward by pressing Ctrl+C in the terminal.
Verification
After signing in, the Grafana home page lists the bundled dashboards: Excalibur Kubernetes Metrics, Excalibur Application Metrics, and Excalibur Application Logs. See the Grafana dashboards reference for what each dashboard contains.
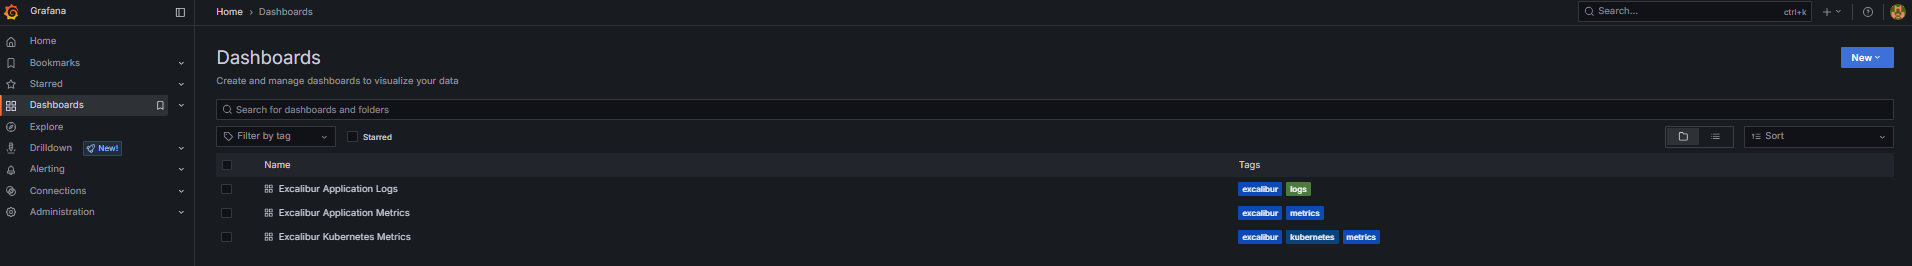
Figure 2. Grafana home page showing the three bundled Excalibur dashboards.
Port-Forward Prometheus
The same approach works for Prometheus when you need to inspect raw scrape targets or ad-hoc queries:
-
Open a port-forward tunnel:
kubectl port-forward -n <namespace> svc/prometheus 9090:9090Expected output:
Forwarding from 127.0.0.1:9090 -> 9090 Forwarding from [::1]:9090 -> 9090 -
Open
http://localhost:9090/targetsin your browser. -
Confirm all five scrape jobs are
UP:prometheus,kubelet-cadvisor,kubelet-volumes,kubernetes-pods,excalibur.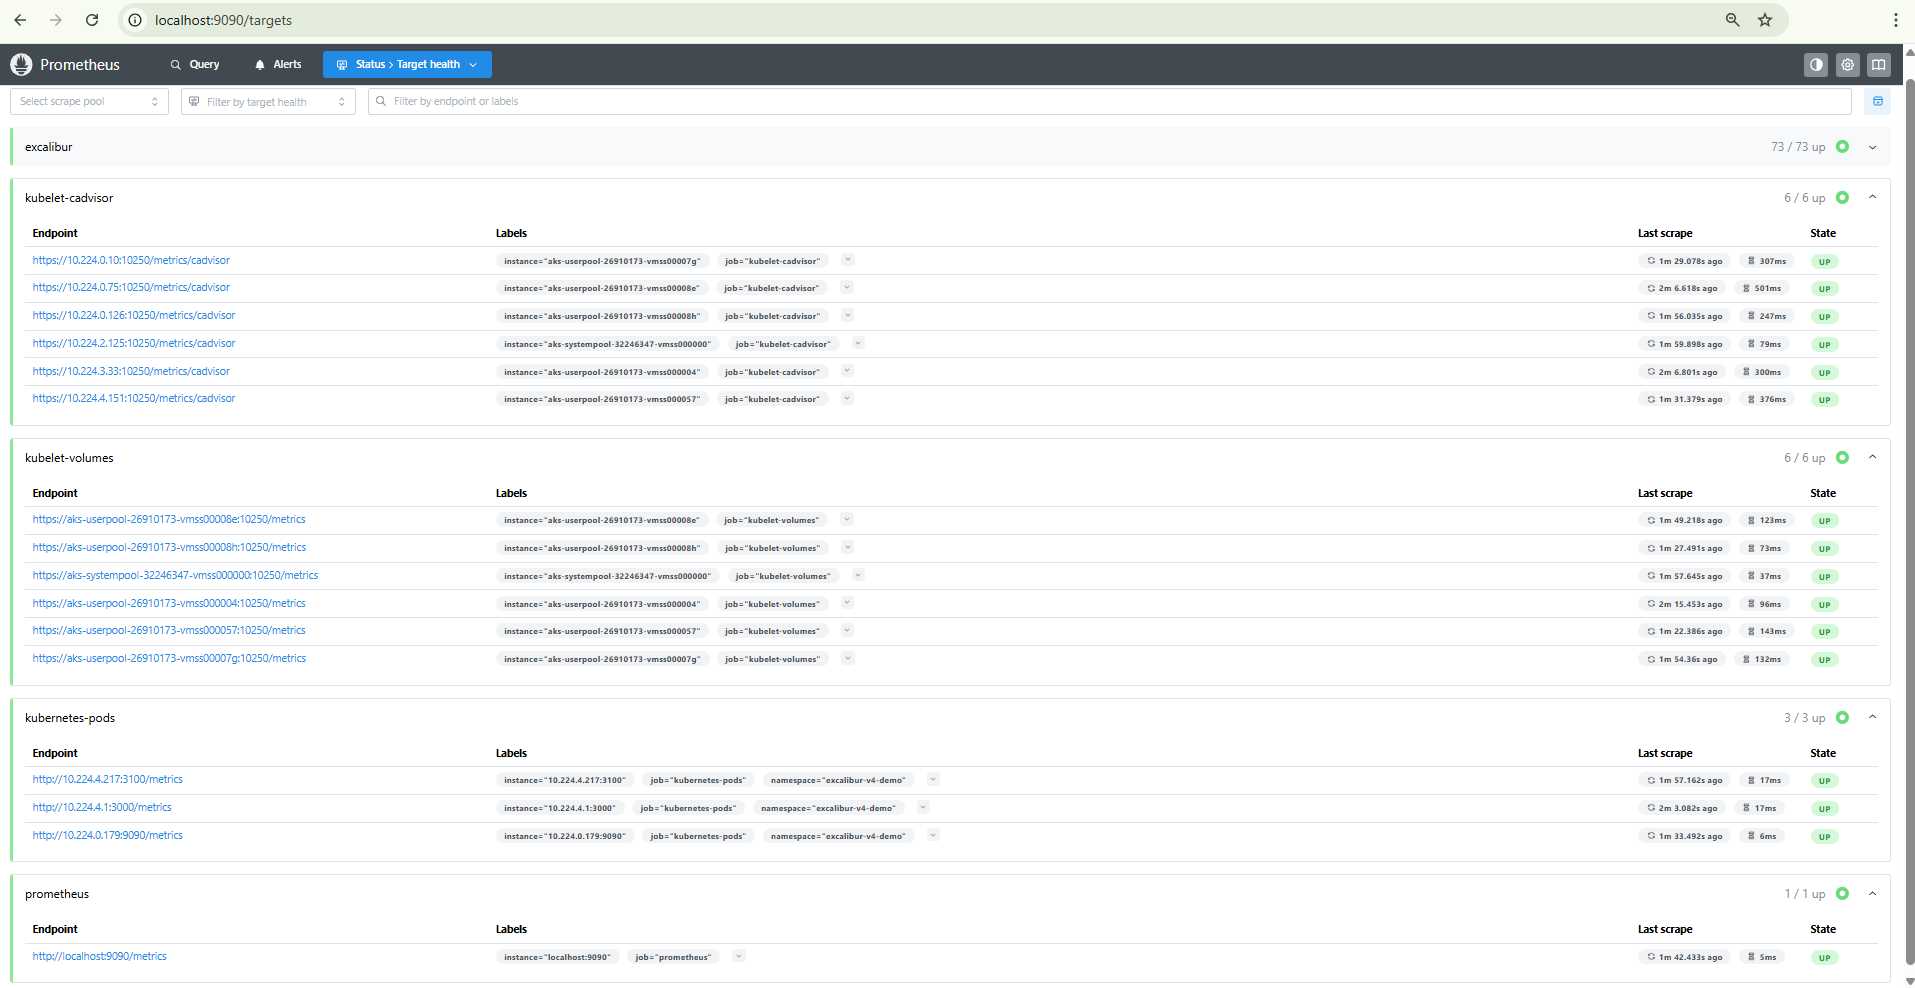
Figure 3. Prometheus targets page with all five scrape jobs in the UP state.
Maintenance Mode
Excalibur supports a maintenance mode that takes the platform offline for end users while keeping Grafana accessible for the operator. Use this mode during planned maintenance windows — for example, when performing a database restore.
What enabling maintenance mode does
When maintenance mode is enabled:
- The proxy switches to a maintenance page that returns HTTP
503for all API calls and displays a user-facing maintenance message for all other routes. - The following backend services are scaled to zero replicas:
api,backup,ca,hsm,repository,token. - A
restoredeployment is started — this pod has read-write access to the backup repository and application data volumes. - Grafana remains accessible at
https://<excalibur-hostname>/admin— the/adminroute is preserved in the maintenance proxy configuration. - Services not in the scale-down list continue running:
database,cache,core,proxy,grafana,prometheus,loki,fluent-bit, and all PAM tenant workloads.
How to enable it
Set maintenanceMode.enabled to true in your Helm values and run a Helm upgrade:
helm upgrade <release-name> excalibur-v4 --set maintenanceMode.enabled=true -n <namespace>
You can also customize the message displayed to end users:
helm upgrade <release-name> excalibur-v4 \
  --set maintenanceMode.enabled=true \
  --set maintenanceMode.message="Scheduled maintenance in progress. Please try again later." \
  -n <namespace>
The default message is: "The system is under maintenance. Please try again later."
How to authenticate
Grafana uses the credentials defined in the admin section of the Helm values (admin.userName and admin.password). No additional IP allow-listing or role configuration is required — Grafana's built-in authentication applies.
How to disable it
Set maintenanceMode.enabled back to false and run a Helm upgrade:
helm upgrade <release-name> excalibur-v4 --set maintenanceMode.enabled=false -n <namespace>
After the upgrade completes, verify the platform is back online:
-
Confirm the scaled-down services are running again:
kubectl get deploy api backup ca hsm repository token -n <namespace>All deployments should show
READY 1/1(or the configured replica count). -
Confirm the maintenance page is no longer served:
curl -I https://<excalibur-hostname>/healthzThe response should return HTTP
200.
Operational guidance
- Keep maintenance windows short. The
restorepod is the primary reason to enable maintenance mode. Disable it as soon as the restore completes. - Communicate the window to end users before enabling maintenance mode. The maintenance page does not include a countdown or ETA — set expectations through your own channels.
- Monitor through Grafana during the window. The
/adminroute remains available so you can watch the restore progress, database connections, and storage usage in real time.
Helm-Chart Exposure
For environments that require Grafana to be permanently reachable from outside the cluster (for example, a dedicated internal monitoring network), the Helm chart provides a value that routes /admin through the proxy ingress.
Use with caution
Permanently exposing Grafana removes the default isolation. Combine this with strong authentication, network restrictions (allow-listed source IPs, VPN-only access), and audit logging before enabling it in any production environment.
The Helm value
Set admin.public to true in your Helm values:
admin:
  email: 'admin@example.com'
  userName: 'admin'
  password: '<strong-password>'
  public: true
Then apply the change:
helm upgrade <release-name> excalibur-v4 -f <values-file> -n <namespace>
What URL Grafana becomes available at
Once enabled, Grafana is reachable at:
https://<excalibur-hostname>/admin
No additional ingress resource is created. The proxy's nginx configuration adds the /admin route to the existing ingress, which proxies requests to the in-cluster grafana service on port 3000.
Ingress and TLS configuration
No additional ingress annotations, host overrides, or certificate configuration is required. The /admin route shares the same TLS certificate and ingress resource as the rest of the Excalibur platform.
Authentication
Grafana uses the credentials defined in the admin section of the Helm values (admin.userName and admin.password). The operator is responsible for setting a strong password before enabling public access.
Recommended hardening
- Set a strong
admin.password— the Grafana login page is publicly reachable whenadmin.public: true. - Restrict source IPs at the ingress controller or cloud load balancer level to limit access to known operator networks.
- Use VPN-only access if the environment supports it — expose the ingress only on an internal network.
- Review Grafana's built-in security settings — consider disabling anonymous access and enforcing session timeouts.
How to verify
After the Helm upgrade, confirm Grafana is reachable:
curl -I https://<excalibur-hostname>/admin
Expected output:
HTTP/2 302
location: /admin/login?redirectTo=
The 302 redirect to the login page confirms the route is active and Grafana is serving requests.
How to roll back
Set admin.public back to false and run a Helm upgrade:
admin:
  public: false
helm upgrade <release-name> excalibur-v4 -f <values-file> -n <namespace>
After the upgrade, https://<excalibur-hostname>/admin returns HTTP 404. Use kubectl port-forward to access Grafana from that point forward.
Related Topics
- Grafana dashboards reference — what each pre-built dashboard contains and when to use it.
- Operational checks for Excalibur workloads — operational checks that reference these dashboards.
- Collect diagnostic data — exporting Loki logs with Excalibur Chronicler for the support team.