Grafana Dashboards Reference
The Excalibur stack includes its own Grafana instance with three pre-built dashboards. Use this page as a reference when investigating issues or interpreting panels.
Access
Grafana is not exposed externally by default. To open the dashboards, follow Access Grafana and Prometheus.
Each dashboard exposes a namespace variable — always set it to the correct deployment namespace before reading panels.
Data Sources and Modes of Use
The two data sources configured by the Helm chart are:
- Loki — application logs (default).
- Prometheus — application and infrastructure metrics.
Grafana has two main modes of use:
- Pre-built dashboards — visualization of metrics and alert state.
- Explore (left sidebar) — direct log investigation through Loki.
The sections below describe the dashboards. Explore usage is covered in the log investigation workflow.
Dashboard: Excalibur Kubernetes Metrics
Purpose: Infrastructure view of the Excalibur namespace — resource consumption, storage usage, and active Prometheus alerts.
When to open this dashboard: When investigating resource pressure, storage filling up, or after receiving a Prometheus alert.
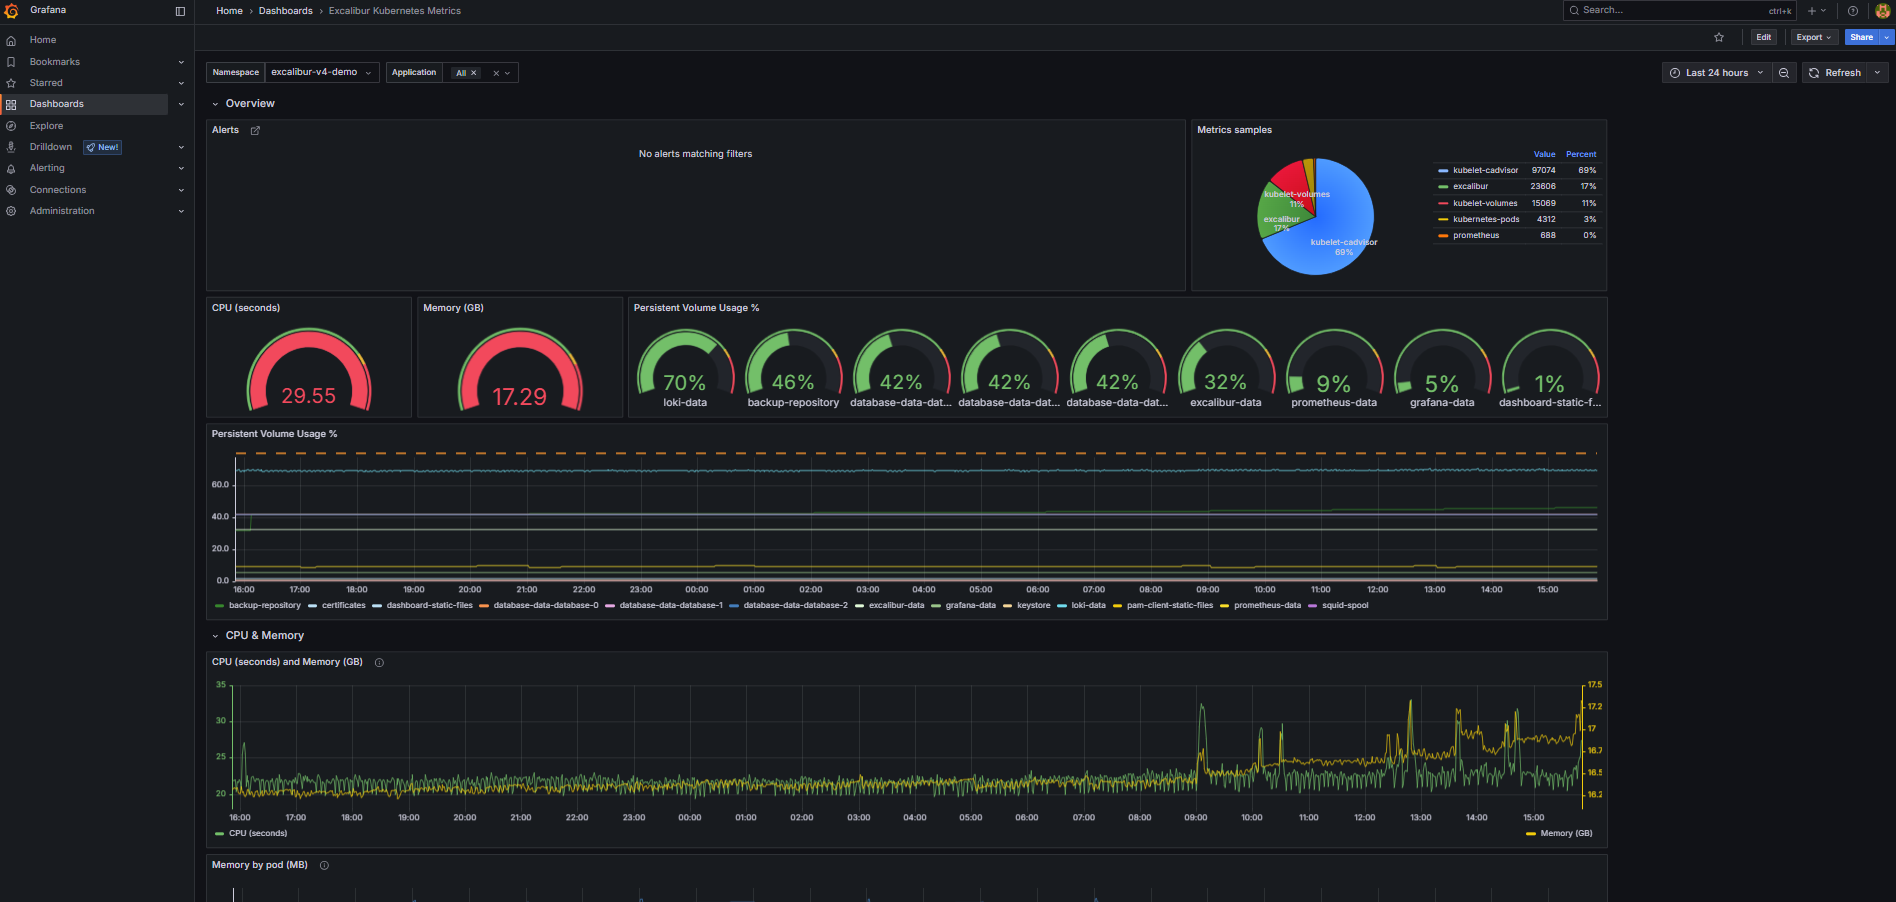
Figure 1. Excalibur Kubernetes Metrics dashboard.
Key panels
Alerts-
Active Prometheus alerts scoped to the namespace, grouped by namespace. Alert rules are defined in Prometheus, not in Grafana — Grafana only reads and displays their state. The default deployment ships a baseline
InstanceDownrule that fires when any Prometheus scrape target stops responding. Any alert here means something is actively wrong. Metrics samples(pie chart)-
The
upstatus and scraped sample count for each Prometheus scrape job. Each slice represents one job (prometheus,kubelet-cadvisor,kubelet-volumes,kubernetes-pods,excalibur). All five should be green (UP). If a job is missing or red, Prometheus has lost that target — dashboards and alerts sourced from that job stop working silently. CPU (seconds)— gauge-
Total CPU usage across all containers in the namespace, averaged over 5-minute windows. A quick check for unexpected CPU spikes across the whole deployment.
Memory (GB)— gauge-
Total memory in use across all containers in the namespace. A value that keeps rising over multiple days without new tenants being added may indicate a memory leak.
Persistent Volume Usage %— gauge-
The single highest-utilized PVC in the namespace. If this is above 80%, open the time-series panel below to identify which volume is filling up.
Persistent Volume Usage %— time-series-
Per-PVC usage over time as a percentage of total capacity. Use this to see which volume is growing and how quickly.
Memory by pod (MB)— time-series-
Memory breakdown per container over time. If a scheduled rolling restart is configured, use this panel to verify memory drops after each restart. A container that keeps accumulating memory without dropping is a candidate for an OOM event.
CPU seconds by container (5m)— time-series-
Per-container CPU usage over time. Use this to identify which specific service is driving unexpected CPU load.
Dashboard: Excalibur Application Metrics
Purpose: Operational state of the Excalibur application — active sessions, API traffic, database connections, LDAP connectivity. The first dashboard to check when a user reports a problem.
When to open this dashboard: When investigating session drops, authentication failures, or API issues.
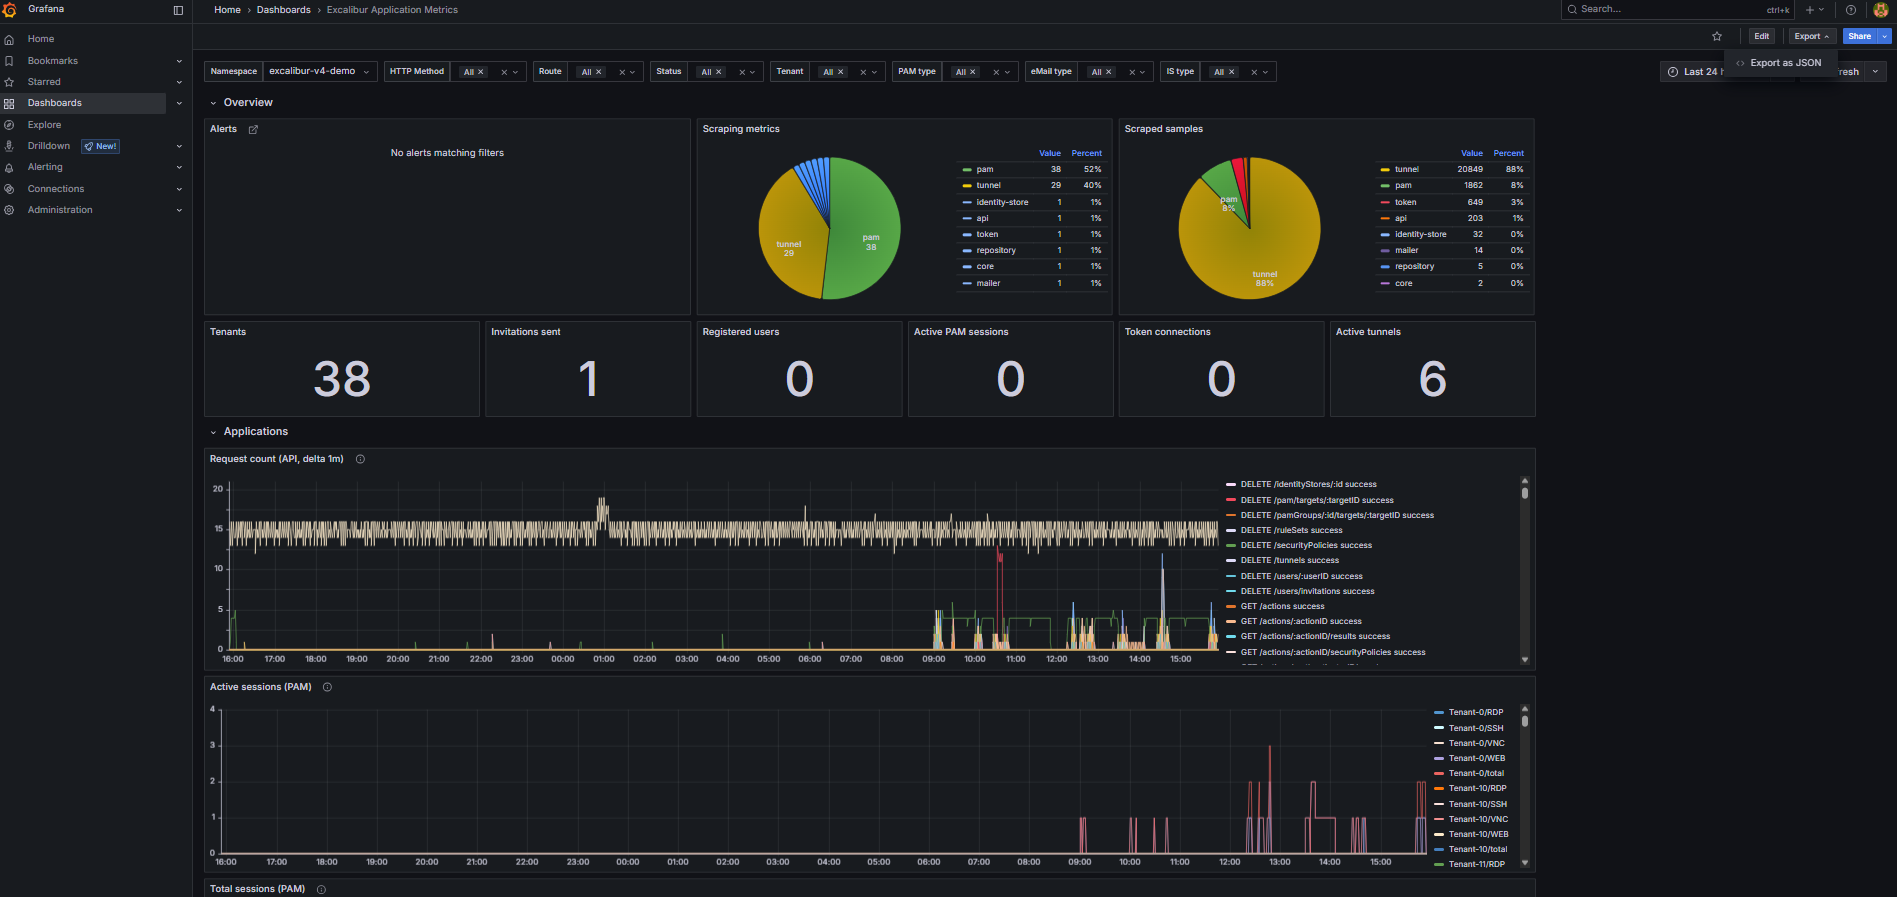
Figure 2. Excalibur Application Metrics dashboard.
Key panels
Alerts-
Active Prometheus alerts. Alert rules are defined in Prometheus — Grafana only reads and displays their state. Unlike the Kubernetes Metrics dashboard, alerts here are not grouped by namespace.
Scraping metrics/Scraped samples-
Health of metrics collection filtered to Excalibur application targets (
job="excalibur"). If a service shows asdownhere, its metrics are missing from all other panels. Tenants-
Count of distinct tenant IDs currently reporting metrics. Useful for confirming which tenants are active.
Active PAM sessions-
Current count of active PAM sessions across all tenants. The primary liveness indicator for PAM functionality. A drop to zero across all tenants simultaneously is a critical signal.
Token connections-
Active authenticated token connections — reflects currently logged-in users with active sessions.
Active tunnels-
Active tunnel sessions. An unexpected drop during business hours warrants investigation.
Request count (API, delta 1m)— time-series-
Rate of API requests broken down by HTTP method, route, and status code. Use this to spot error rates (
4xx,5xx) or a complete drop in API traffic. A drop to zero during business hours means the API is not receiving requests. Active sessions (PAM)— time-series-
PAM session count per tenant over time. Use the tenant filter to correlate session drops with a specific tenant.
Connected LDAPs (Identity-Store)— time-series-
Active LDAP/AD connections per tenant. Should equal the number of configured directory stores. A drop indicates
identity-storehas lost connectivity to the directory. Database pool connections (Repository)— time-series-
Active database connections from the
repositoryservice. A drop to zero here often appears before the database pod itself shows as unhealthy — use it for early detection. Active sessions (Tunnel)— time-series-
Tunnel session count per tenant over time.
Dashboard: Excalibur Application Logs
Purpose: Log volume and error rate across all Excalibur services. The primary tool for log-based investigation. All time-series panels are click-through — clicking a data point opens the underlying Loki logs for that time window.
When to open this dashboard: When investigating an error spike, unexpected service behavior, or after a Helm upgrade.
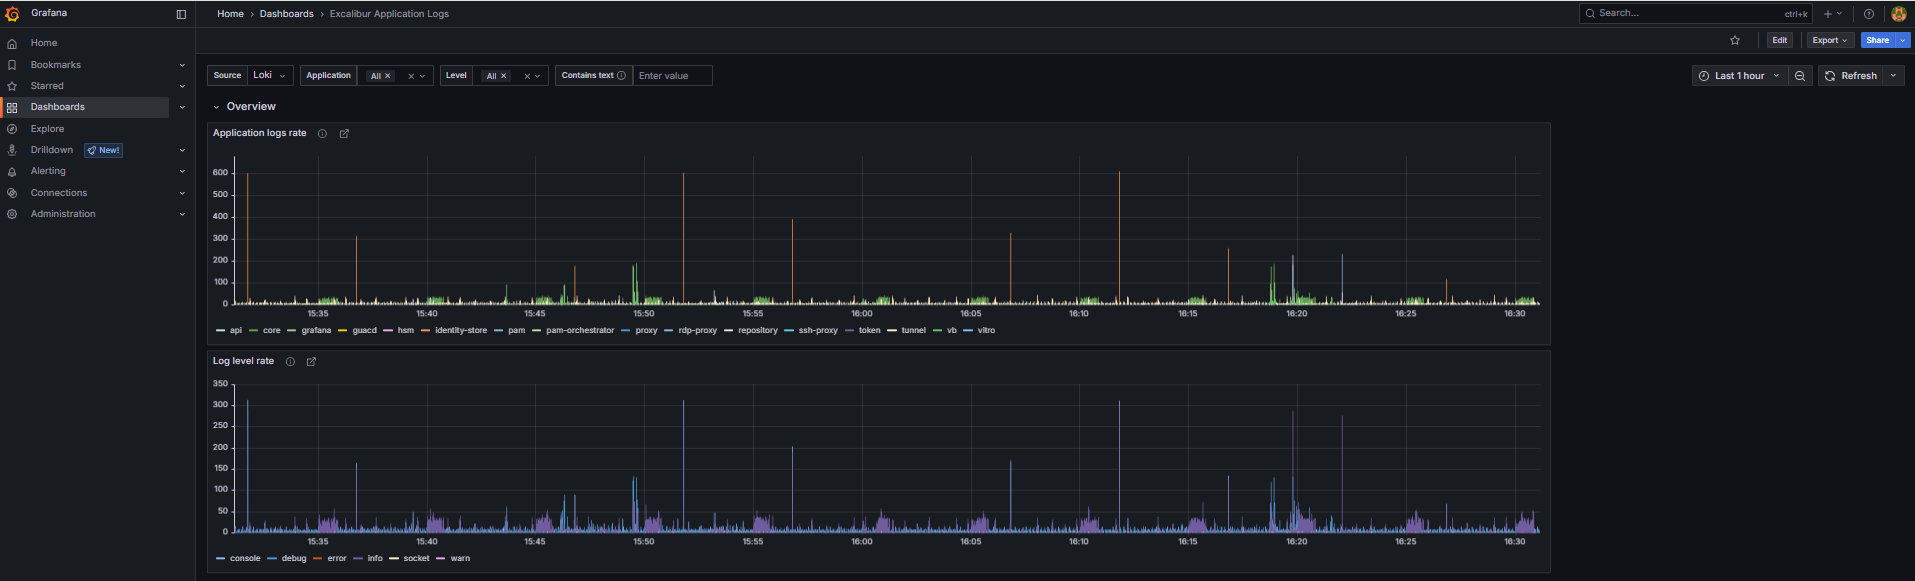
Figure 3. Excalibur Application Logs dashboard.
Key panels
Application logs rate— time-series-
Log messages per second broken down by service name. A flat line for a service that should be active means it has stopped running or stopped logging. A spike in one service while others are normal points to that service as the source of an issue. Use the
appNamevariable to filter to a specific service. Log level rate— time-series-
Log volume broken down by level (
info,warn,error,fatal). A spike inerrororfatalis the fastest indicator of an application-level problem. Click the spike to see the raw log entries. UNIMPLEMENTED error in logs— time-series-
Counts occurrences of gRPC
UNIMPLEMENTEDerrors, broken down by service name. This should always be zero in a healthy deployment. Any value appearing after a Helm upgrade indicates a version mismatch — one service is calling an API method another service no longer provides.
How to investigate logs
To query logs directly, use the Explore view in Grafana (left sidebar). Select Loki as the data source, then add a label filter product = excalibur-v4 to scope results to the Excalibur deployment. To narrow down to a specific service, add a second filter on appName.
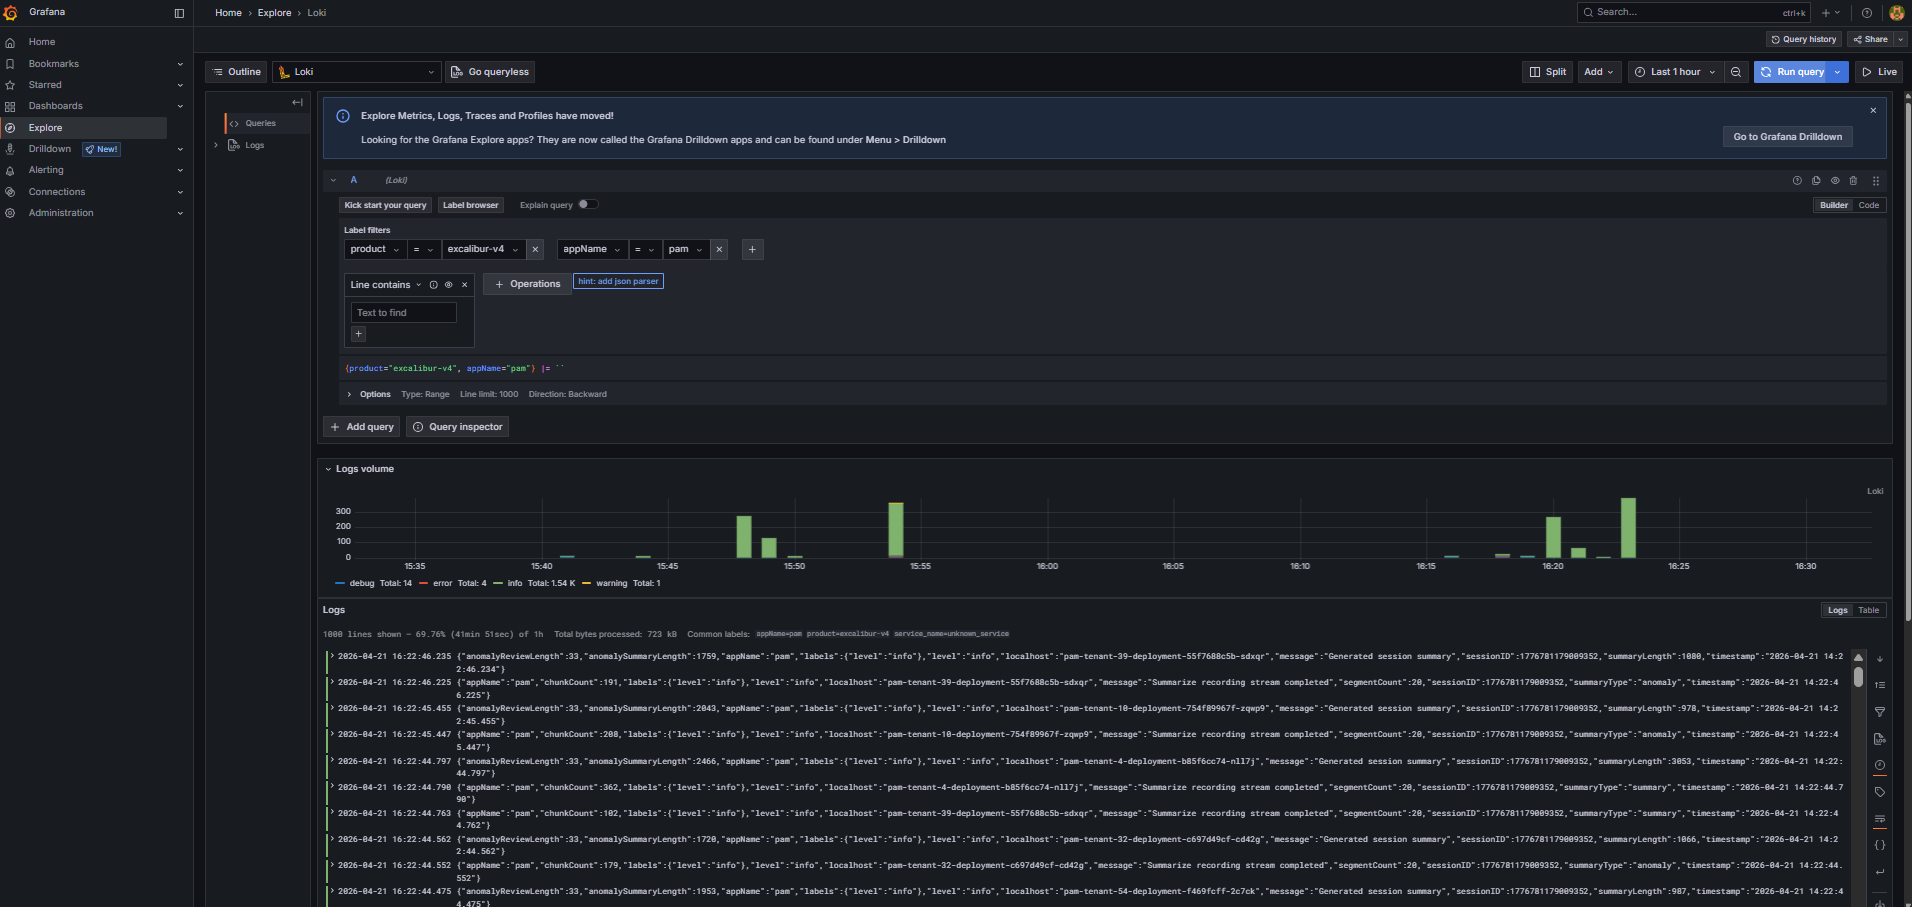
Figure 4. Grafana Explore view with Loki label filters.
- Open Application logs rate and identify which service shows unusual activity — a spike or a sudden gap.
- Click the data point to open Loki logs for that service and time window.
- Use the Log level rate panel to confirm whether the spike is errors or just increased normal traffic.
- Use the
levelvariable to filter toerrororfatalentries only. - If the issue appeared after an upgrade, also check the UNIMPLEMENTED panel for version mismatch errors.
- Use the
textvariable for free-text search within the log stream.
Related Topics
- Access Grafana and Prometheus — how to reach Grafana when it is not exposed externally.
- Collect diagnostic data — export Loki logs with Excalibur Chronicler for the support team.