Release Notes 2026.08.4
Overview
This document outlines the updates and improvements introduced in Excalibur 2026.08.4, released on August 18, 2026.
This release centers on observability for self-managed deployments. Excalibur now ships a dedicated, cluster-wide observability stack and connects to it through the application chart, with new Grafana dashboards for PAM sessions and for fleet and tenancy footprint. It also makes PAM session records more accurate, speeds up recovery after a tunnel server restart, and shows the product version on the login and setup screens. Under the hood, this is also the broadest third-party dependency refresh in recent releases, bringing the whole stack up to date with the latest upstream security and stability fixes. Self-hosted operators should review the Configuration Changes section before upgrading.
New Features
Centralized observability for self-managed deployments
Earlier versions bundled a per-namespace monitoring stack (Grafana, Loki, Prometheus, and a log forwarder) inside the application deployment. That stack was duplicated in every namespace, hard to operate at scale, and coupled monitoring to the application release.
Excalibur now separates the two. The application chart ships lightweight integration points instead of its own monitoring workloads: a logging label so a cluster log collector can pick up each service's output, and opt-in resources that expose metrics, alerting rules, and dashboards to a Prometheus-Operator-based stack. A new companion chart, excalibur-observability, provides that stack once per cluster: Prometheus, Alertmanager, Grafana, Loki, and Grafana Alloy, pre-wired to discover everything the application publishes.
The result is a single, cluster-wide place for metrics and logs that you upgrade independently of the application, and the option to connect Excalibur to a monitoring stack you already run. This applies to self-managed deployments; Excalibur-hosted environments already run this stack. See Configuration Changes for the upgrade steps.
Fleet and tenancy dashboard
Operators previously had no way to see the shape of a deployment from Grafana. Answering questions like how many tenants run in each namespace, how many users and PAM targets exist, or which tunnel agent versions are in use meant querying the database directly.
A new Fleet and Tenancy dashboard answers these from Grafana. With no namespace selected it shows a fleet-wide view across the whole cluster; selecting a namespace or tenant narrows every panel to that scope. It covers tenants, users, PAM targets by type, tunnels and their agent versions, identity stores, and the access and configuration footprint.
The dashboard ships with the observability stack described above.
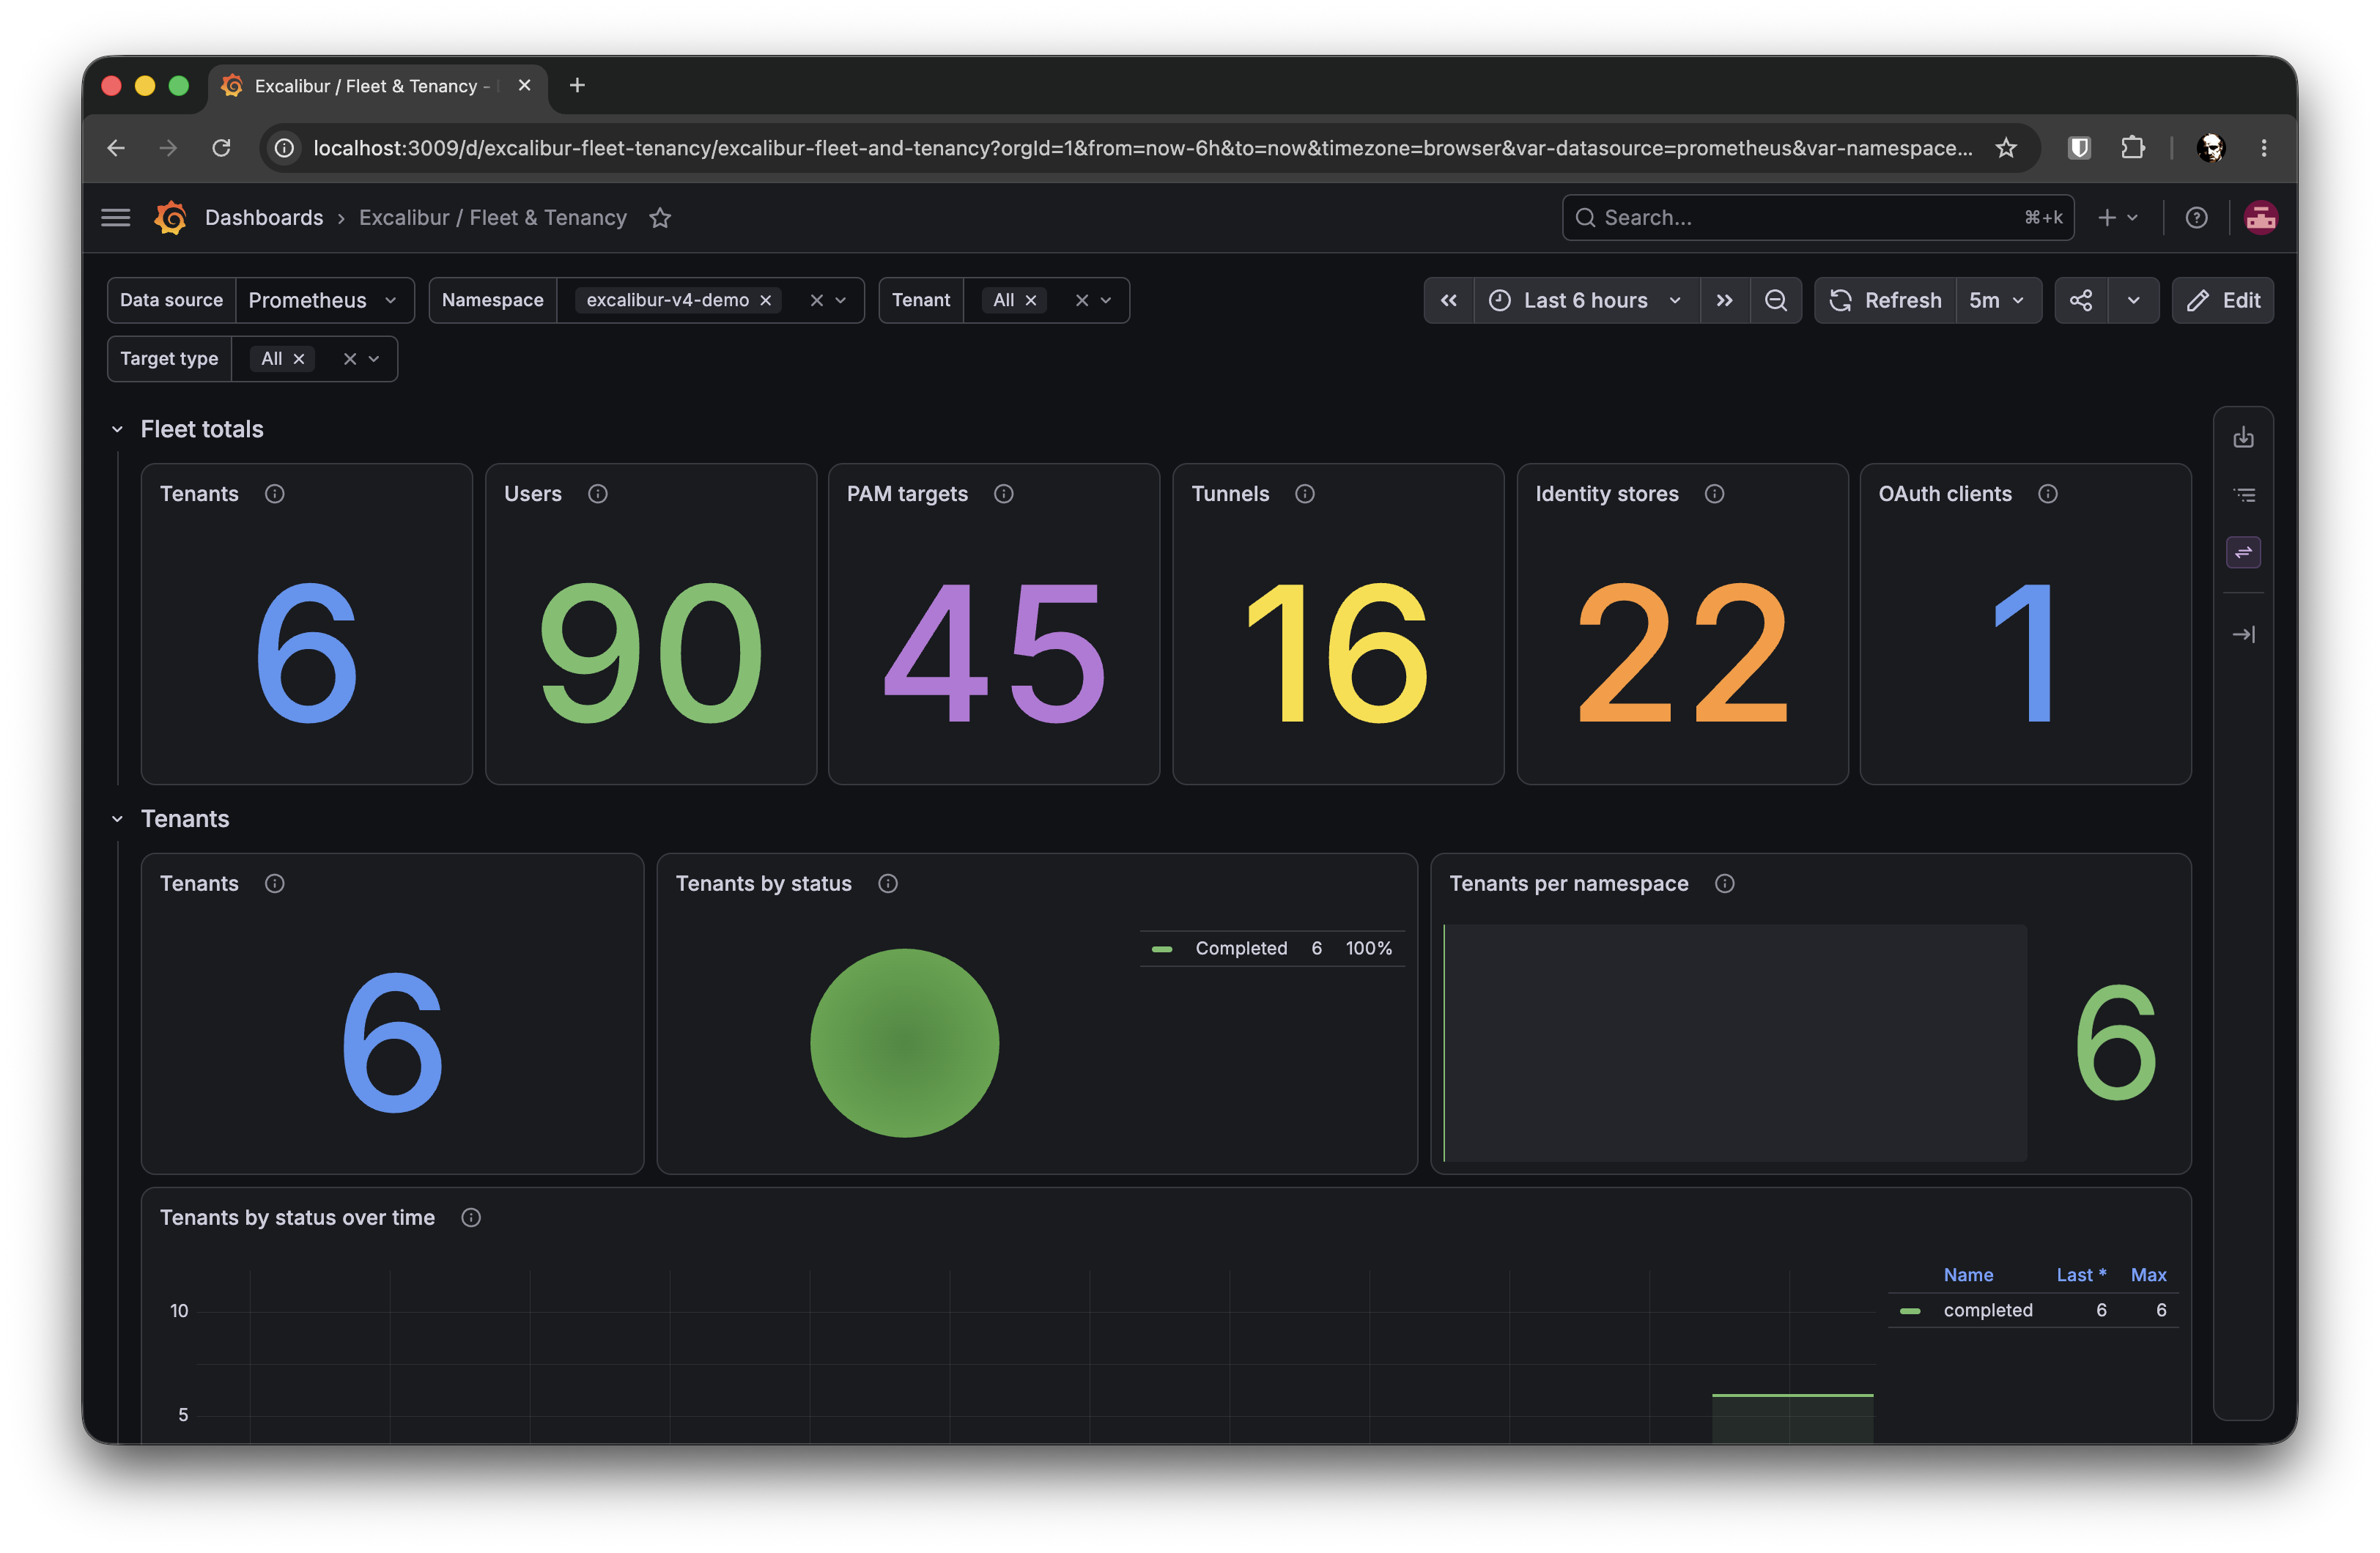
Figure 1. The Fleet and Tenancy dashboard, fleet-wide view
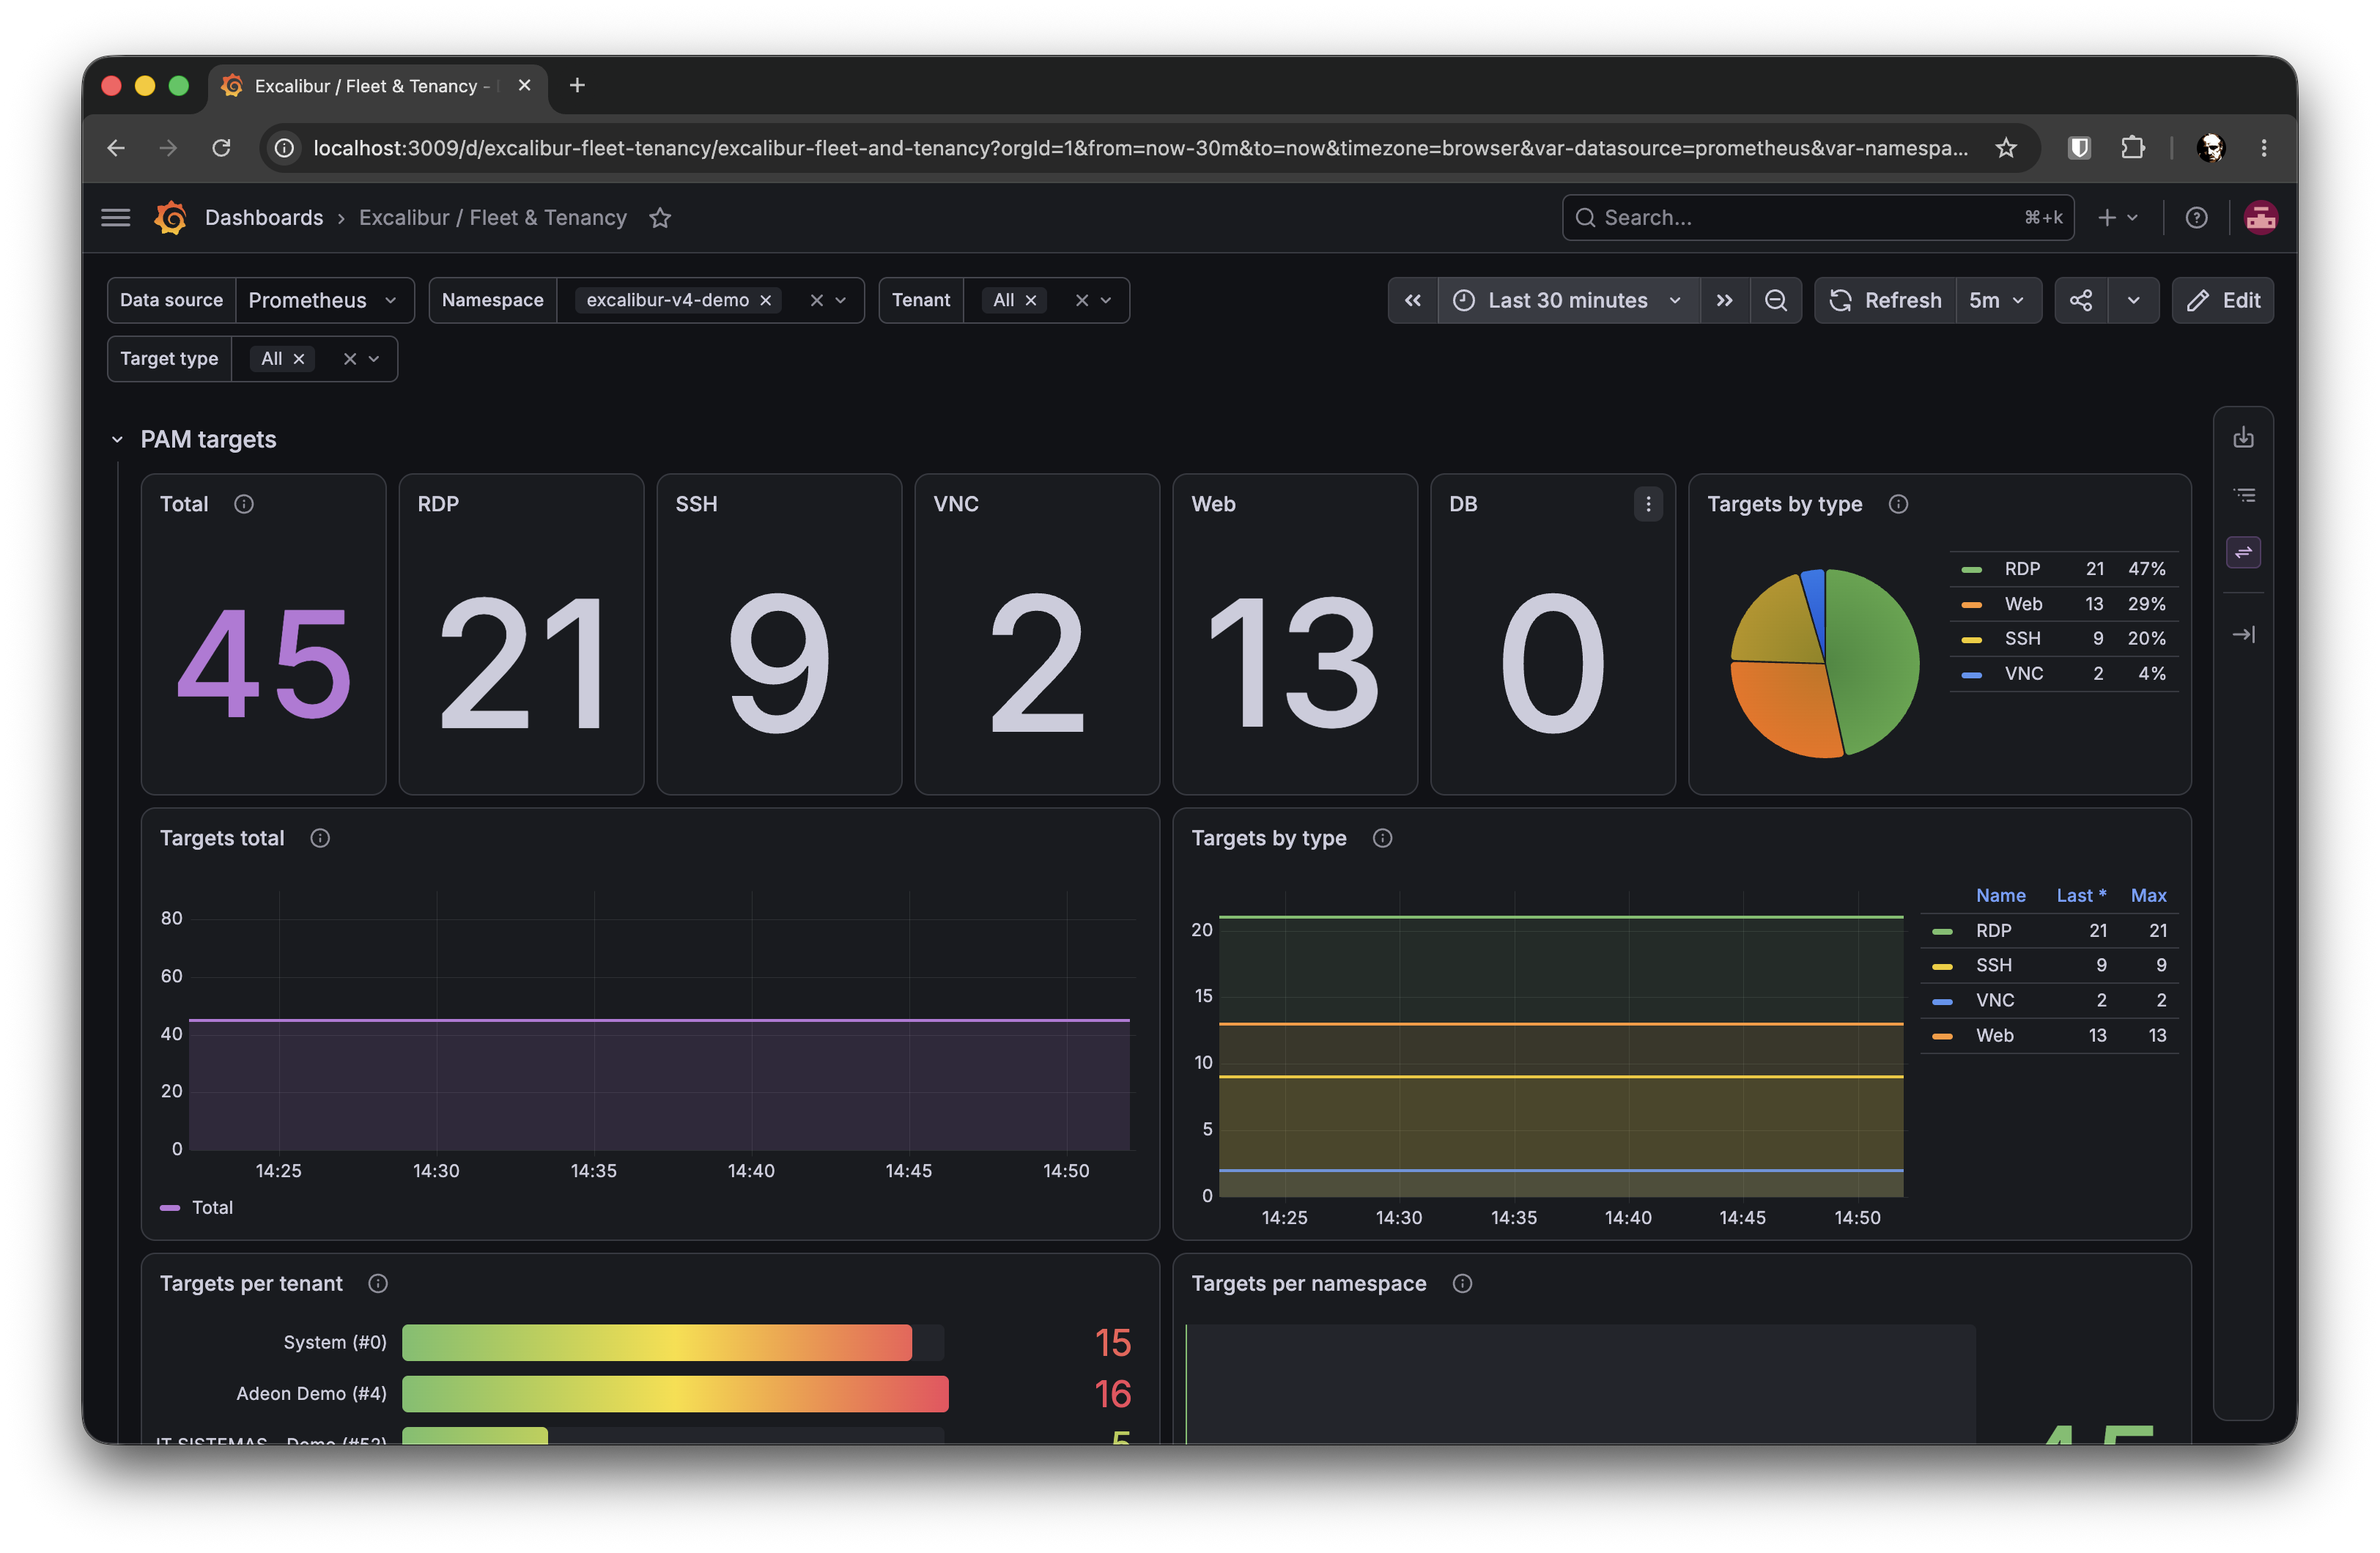
Figure 2. The Fleet and Tenancy dashboard PAM targets, fleet-wide view
Product version on the login and setup screens
The product version was visible inside the application once signed in, but not on the login screen or the first-run setup wizard. Identifying the running version before signing in meant inspecting the deployment.
The login and setup screens now show the running product version as a subtle label in the lower-left corner. It is read before sign-in, appears in every supported language, and stays out of the way: if the version cannot be determined it simply does not render, and it never interrupts signing in or setup.
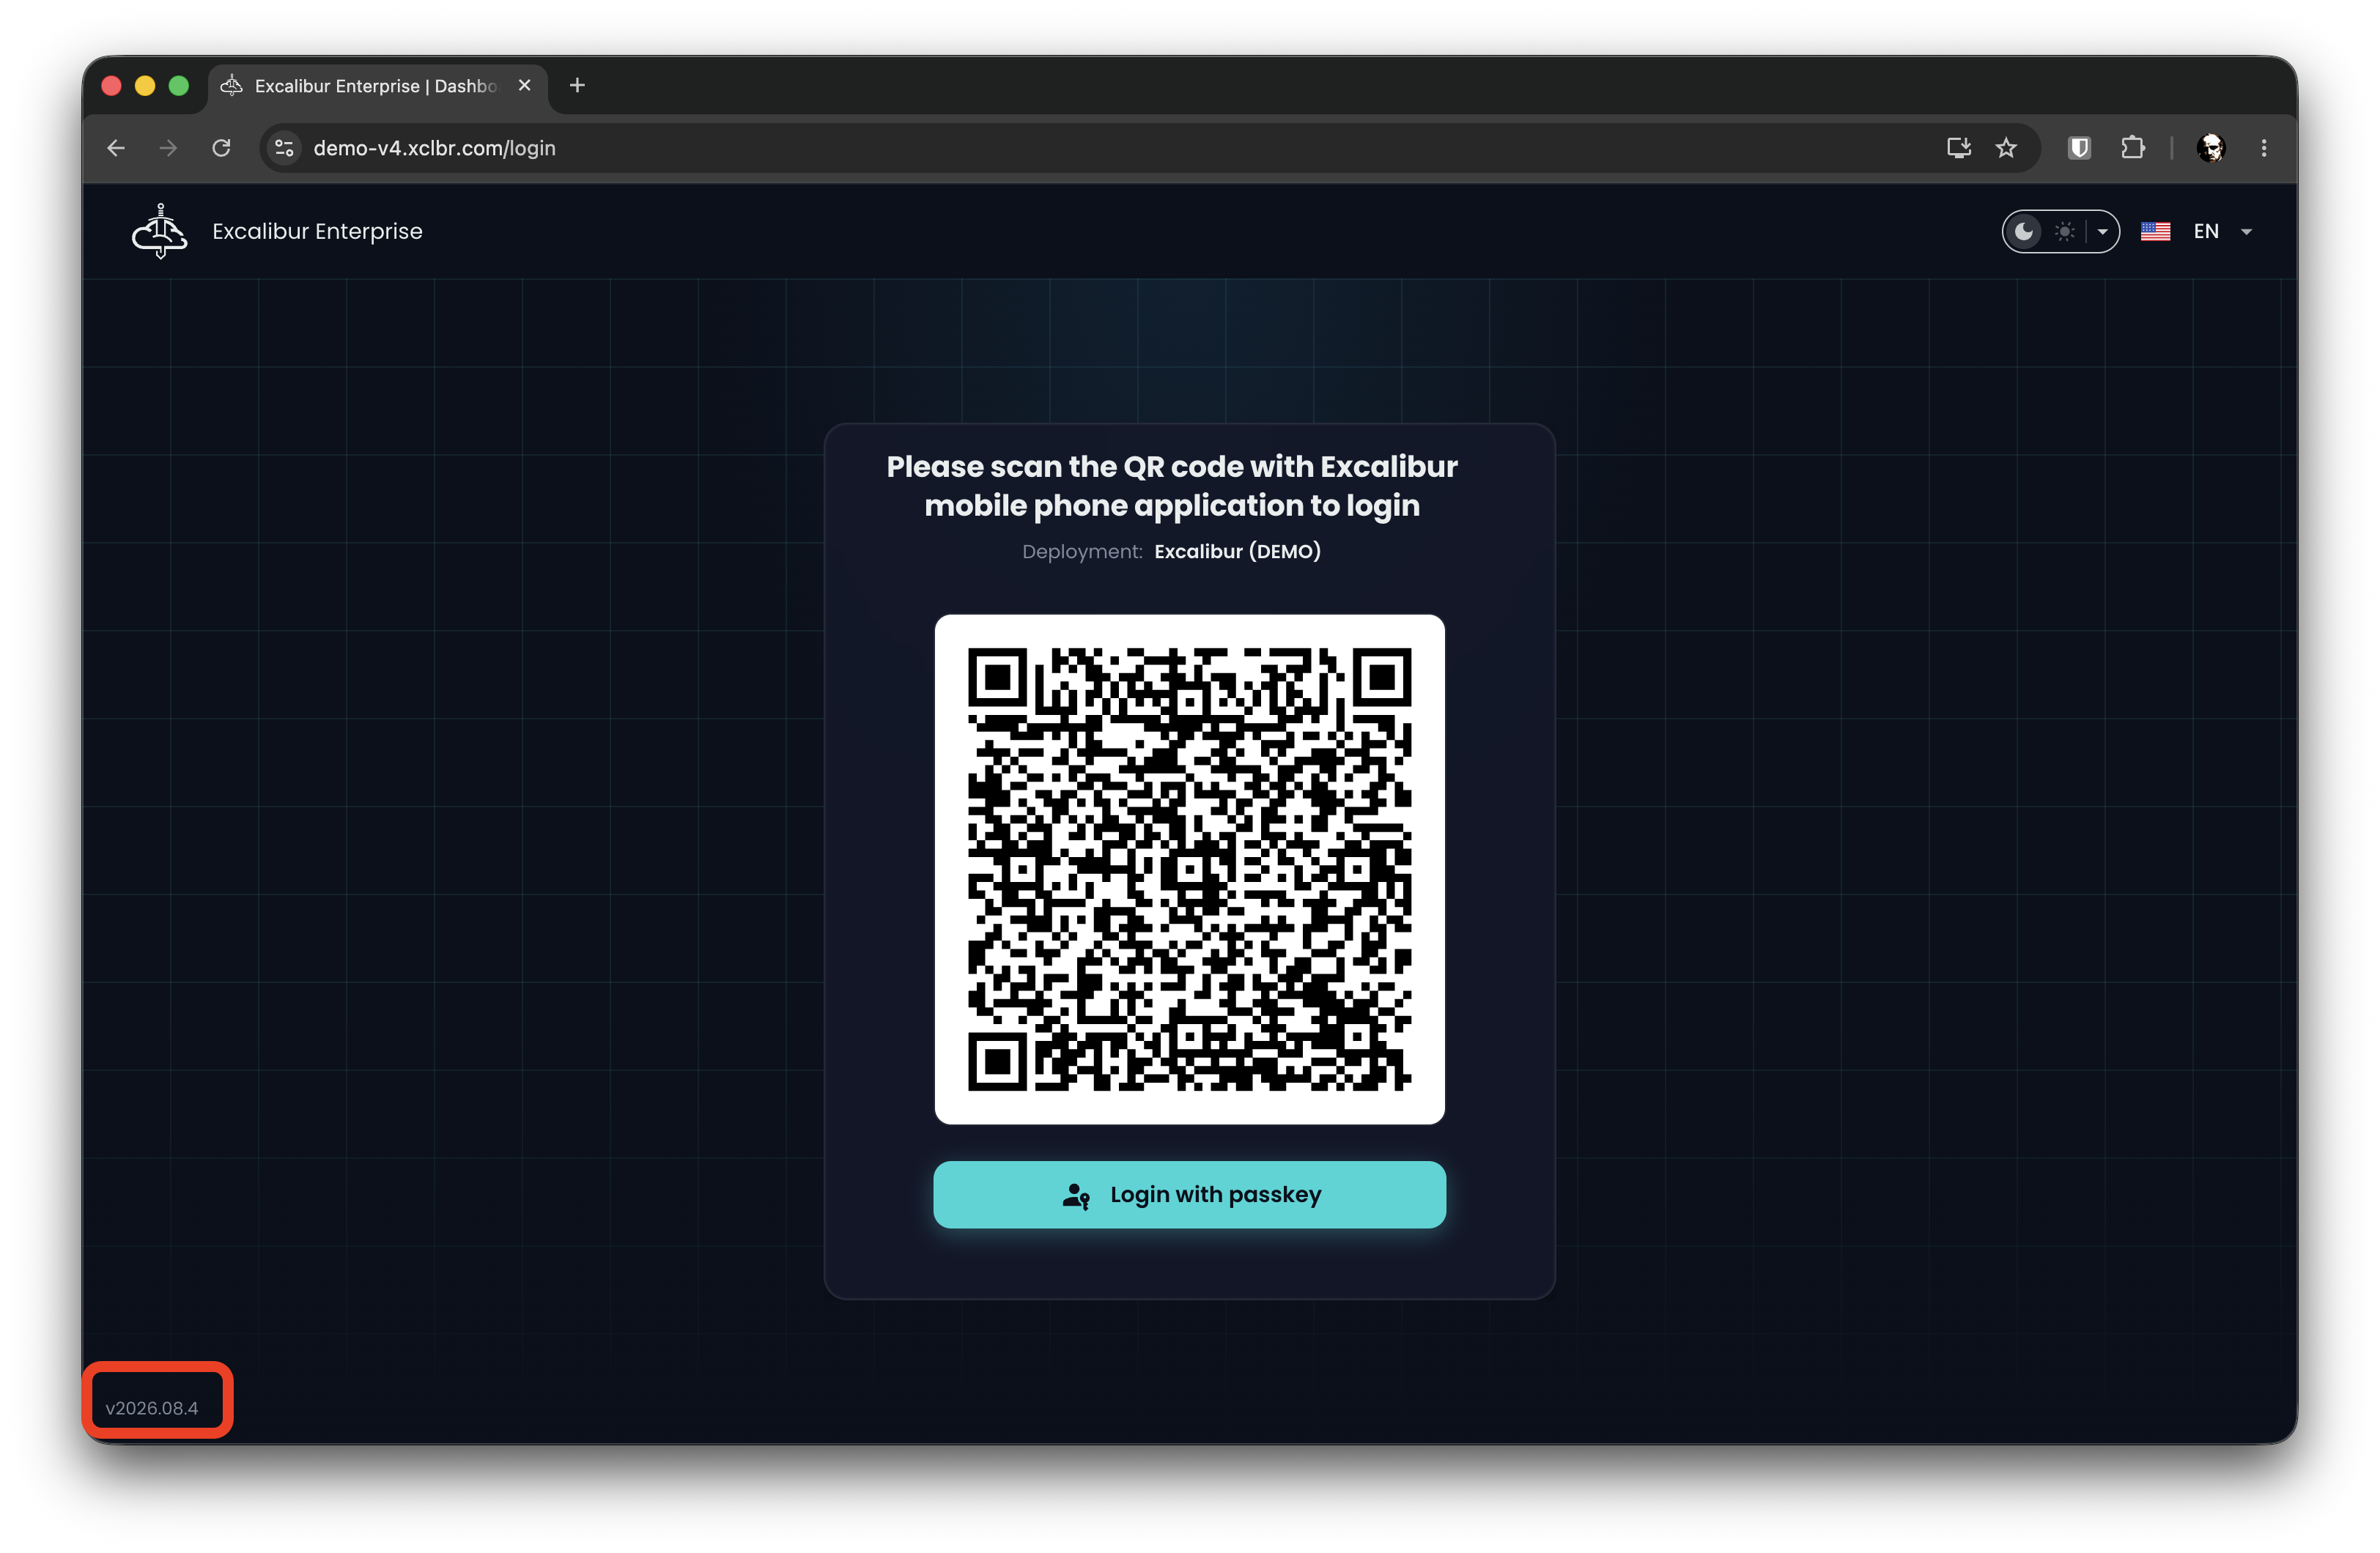
Figure 3. The product version on the login screen
Improvements
Redesigned PAM session dashboards with accurate, tenant-aware metrics
The active-session metric was previously reported by each PAM pod from its in-memory state. It could drift from the real number of open sessions, reset to zero whenever a pod restarted, and had no dependable per-tenant breakdown, so the session dashboard could only approximate which tenant a session belonged to.
Session metrics are now derived directly from the database and labeled by tenant, session type, and whether the session runs over a tunnel. They survive pod restarts, count active and total sessions, and add session throughput and duration. The PAM session dashboards were redesigned around namespace and tenant, and a new cluster overview summarizes sessions across all namespaces.
These dashboards ship with the observability stack.
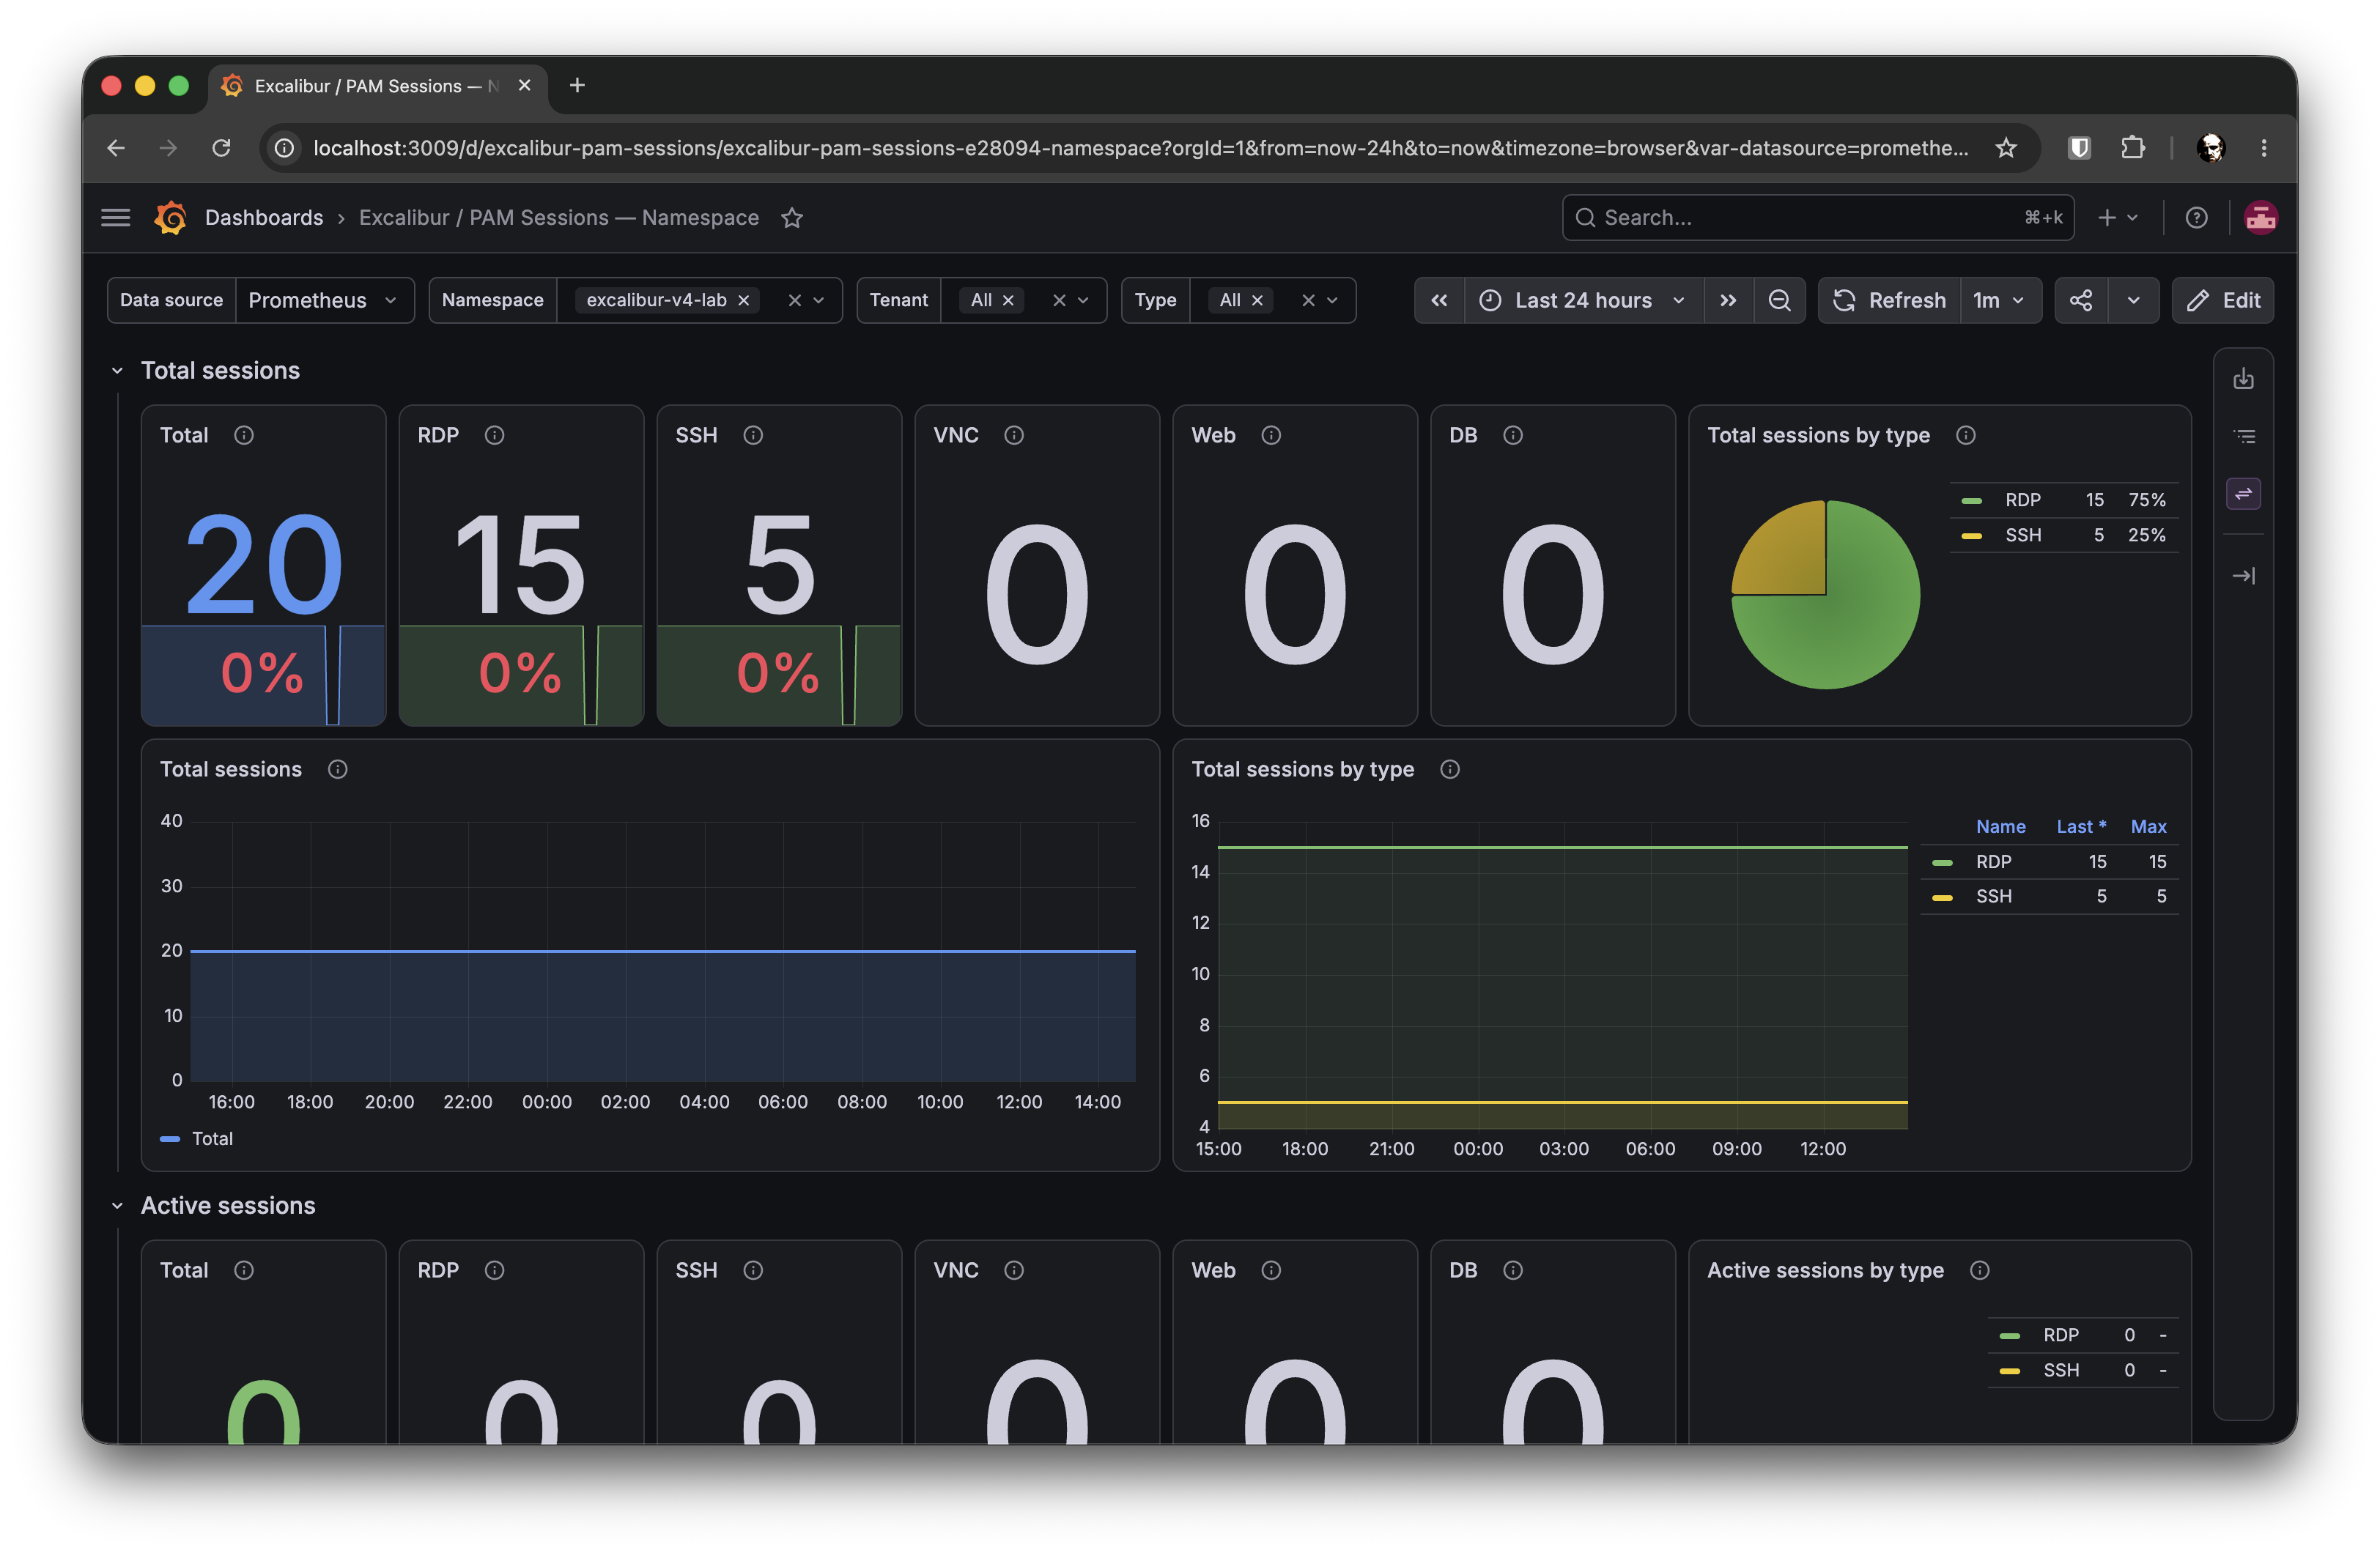
Figure 4.PAM session dashboard, per-namespace view
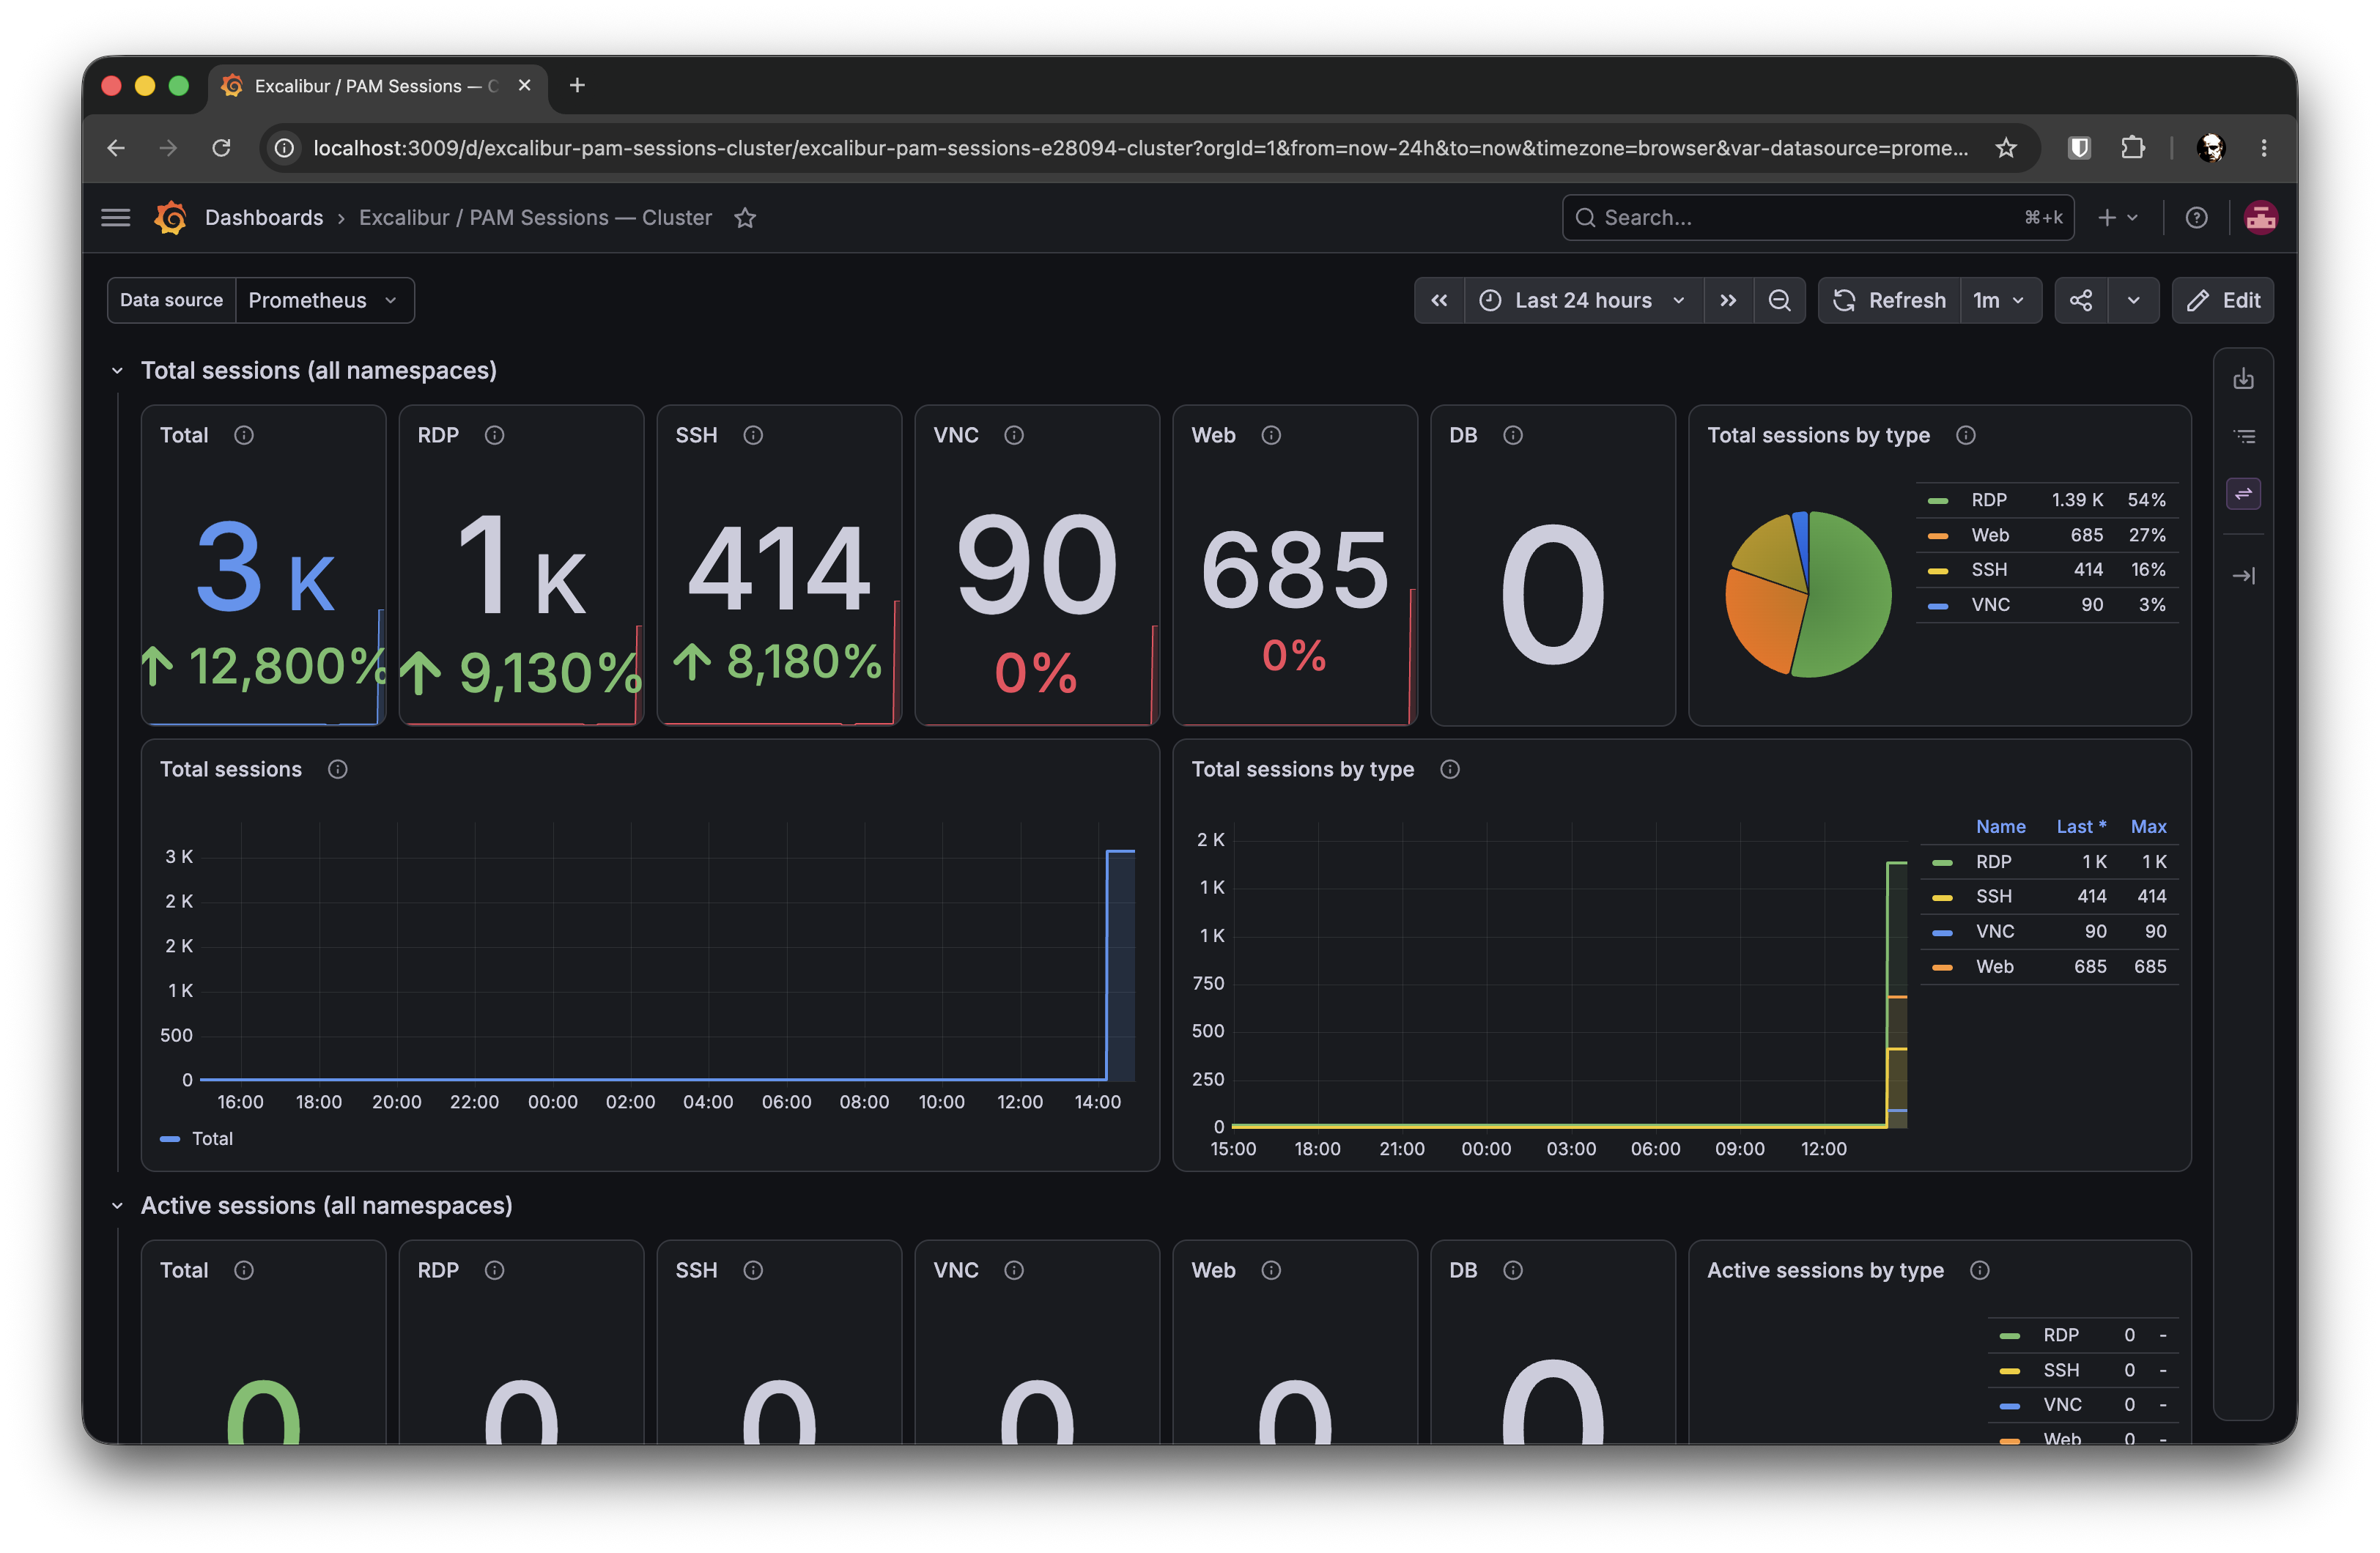
Figure 5.PAM session dashboard, cluster overview
Fixes
Remote access reliability
PAM sessions could stay listed as active after they had ended
When a PAM connection dropped without a clean disconnect, for example a network drop, a client going to sleep, or a pod restart, the session's end time was sometimes never recorded. The session kept showing as active in session and audit views, in some cases for several days, and the routine cleanup could not correct it.
Session termination is now reliable. Every way a session can end writes the end time immediately, and an independent, database-driven cleanup closes any session that outlived its deadline, so stale sessions are no longer left open. The connection between the client and the session is also monitored more closely, so a session whose client has silently gone away is detected and closed within a short, bounded window instead of lingering.
Sessions took several minutes to recover after a tunnel server restart
After a routine restart of the tunnel server, for example during an upgrade or node maintenance, a connected client could take around fourteen minutes to notice the drop and reconnect, so access through that tunnel was interrupted for the whole period even though it eventually recovered on its own.
Clients now detect a dropped or unresponsive tunnel connection within seconds and reconnect, using a staggered, increasing retry delay so that many clients reconnecting at once do not overwhelm the server. This requires the updated tunnel client.
Self-managed deployments
The maintenance page could fail to appear when monitoring was disabled
On deployments that ran without the bundled monitoring, enabling maintenance mode could leave the proxy repeatedly restarting instead of serving the maintenance page, so users saw a broken or degraded page during the maintenance window. Data was never at risk; the write freeze still applied.
The proxy no longer depends on the monitoring component, so maintenance mode now serves its page cleanly whether or not monitoring is deployed.
Configuration Changes
Action required for self-hosted deployments
If you manage your own Helm values, review these changes before you upgrade. Excalibur-hosted (SaaS) environments are updated automatically and require no action.
This release completes the move to a separate observability stack, which changes the application chart.
The application chart no longer deploys its own Grafana, Loki, Prometheus, or log forwarder, and their data volumes and the Grafana admin secret are gone. To keep dashboards, metrics, and logs, install the new excalibur-observability companion chart (once per cluster) or connect Excalibur to your existing Prometheus-Operator-based stack, then enable the integration points below. When you enable the metric and alerting hooks, the Prometheus Operator custom resource definitions must be present in the cluster.
New application-chart values:
| Value | Default | Notes |
|---|---|---|
| logging.enabled | true | Adds a logging label so a cluster log collector can select each service's output. Enabling it causes a one-time rolling restart on upgrade. |
| logging.stack | excalibur | Identifies the log stack the label targets. |
| metrics.serviceMonitor.enabled | false | Opt-in. Publishes service metrics to a Prometheus-Operator stack. |
| alerts.prometheusRule.enabled | false | Opt-in. Publishes alerting rules. |
| dashboards.enabled | false | Opt-in. Publishes Grafana dashboards. |
Removed and renamed settings:
- The admin section of the values file has been removed, and the values schema now rejects unknown keys. If your values still contain an admin block, remove it before upgrading, or the upgrade will be rejected.
- Certificate email is now set through its own ACME_EMAIL setting. Set it before upgrading: the certificate scripts now stop with an error if it is missing rather than falling back to a placeholder. The former admin email, username, password, and public-admin settings have been removed.
- Grafana is no longer served under the /admin path of the application. Reach the cluster-wide Grafana through the observability stack (for example, a port-forward or its own ingress).
Other notes:
- Sending service logs to a Loki endpoint is still supported; only the bundled Loki deployment was removed.
- For the two Go-based services, log output is now standardized JSON on standard output. If you forward these logs to a SIEM and parse specific field names, update your parsing to the new field names.
Security and Maintenance
Platform-wide dependency modernization
The whole stack is now up to date
The largest change in this release is one you will not see directly: the third-party foundation was refreshed across the platform. Nearly every service moved up to current releases of its runtime, framework, and build dependencies, applied as small, individually tested steps so that behavior stays the same.
Keeping these components current aligns Excalibur with the latest upstream security and stability fixes and reduces exposure to issues that newer versions have already resolved. It also keeps the platform on actively supported releases, which makes future upgrades smoother and safer. No action is required: the updates are built into this release and picked up automatically when you upgrade.
Ongoing hardening
This release also includes routine security hardening and behind-the-scenes improvements to logging, configuration handling, reliability, and our release process. These strengthen the product without changing how you use it day to day.
For full configuration guidance, see the Installation and Implementation Guide.