Dashboard tour
The dashboard is mounted at /dashboard/ and serves as the primary
operator UI. Every page in this section is reachable from the
sidebar on the left.
The header strip above every page shows three things:
- A green/red connection state dot
- The last refresh timestamp
- The current operating mode badge —
DISCOVERY,SHADOW, orENFORCEMENT(red)
A Bearer token (optional) field on the top-right lets you switch
RBAC role for the current browser session.
The sidebar groups pages into:
- Observe — Overview, Sessions, Flows, Domains, Workstation
- Credentials — Escrow & Surrogates, Lineage, Onboarding
- Identity — Sessions & Services, Fleet & Namespaces, NetBird, Swarm
- Policy — Egress, Translation Auth, Adapters, Crypto Mediation
- Operate — Reviews, Audit, Threat & Feeds, Operations
Observe
Real-time visibility into traffic, sessions, and destinations.
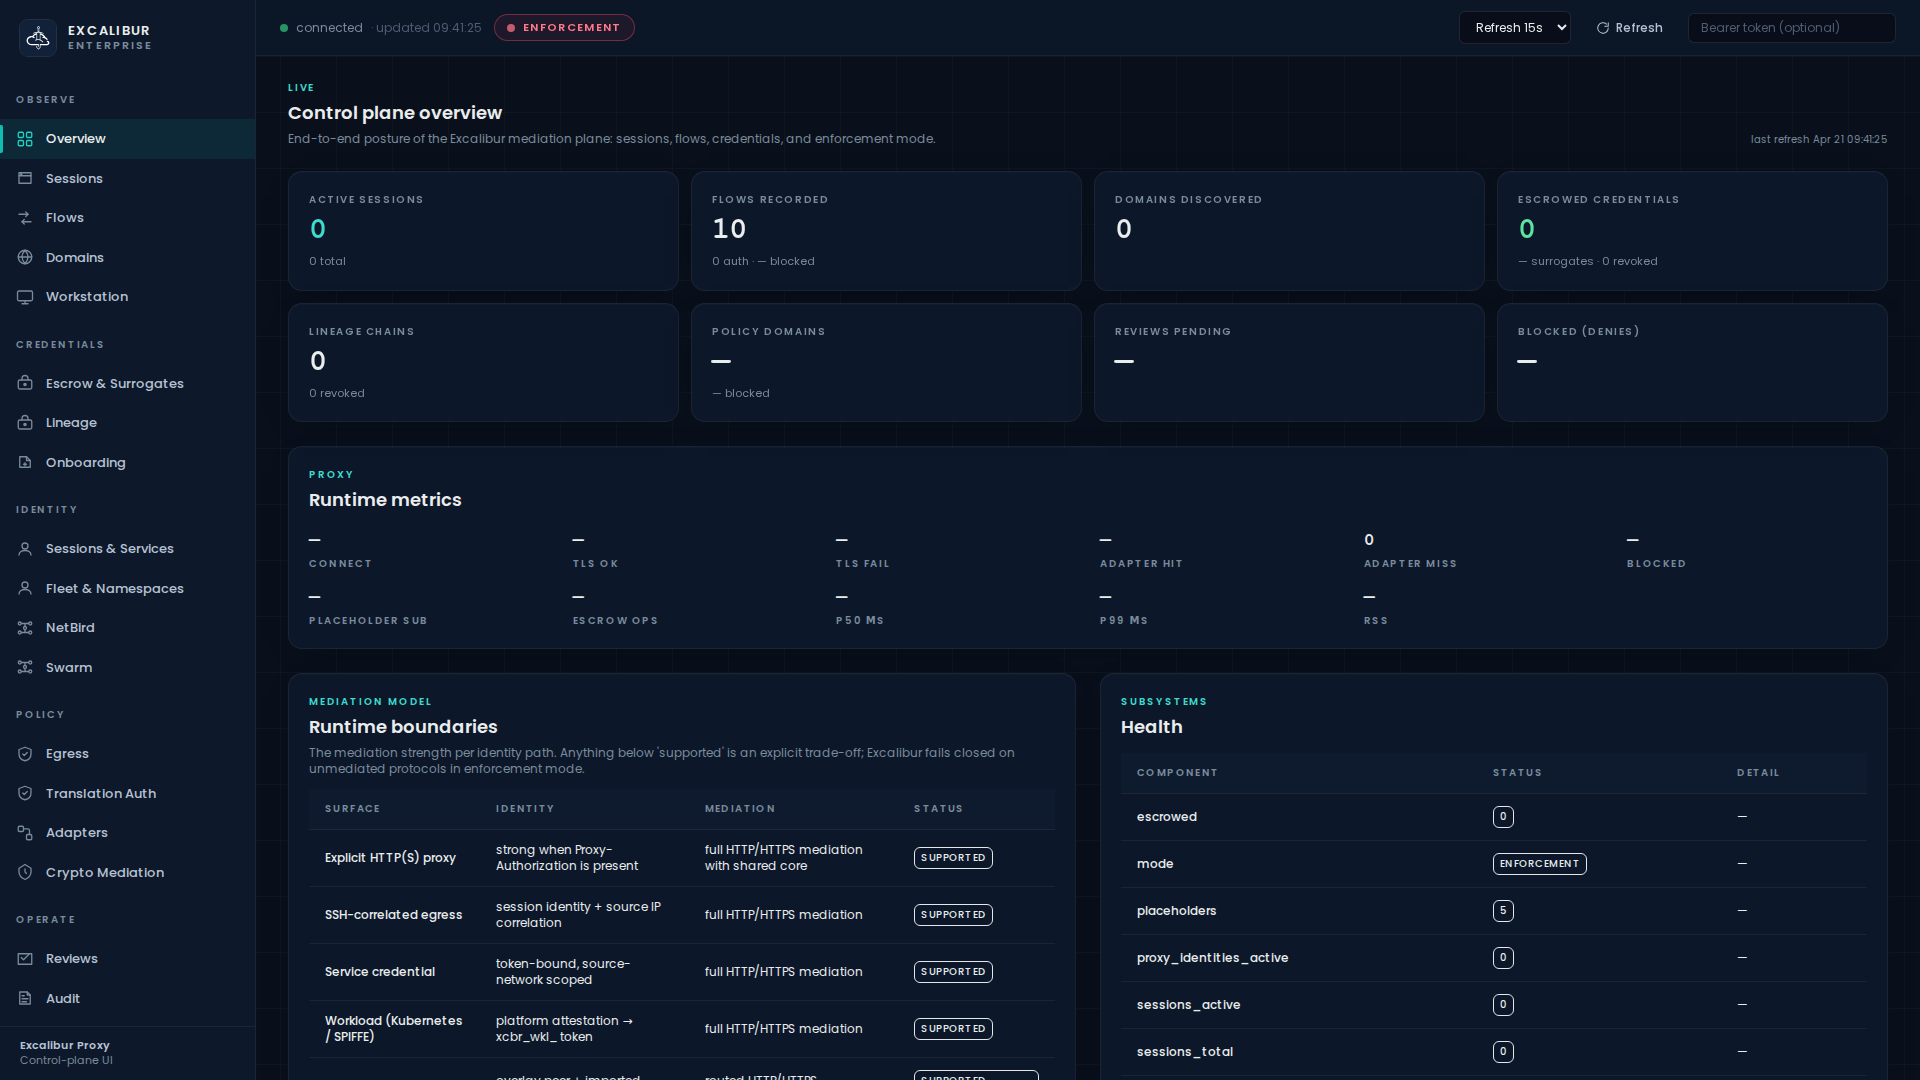
Overview — /dashboard/
KPI cards for Active sessions, Flows recorded, Domains discovered, Escrowed credentials, Lineage chains, Policy domains, Reviews pending, and Blocked (denies).
Below: a Runtime metrics panel (CONNECT, TLS ok, TLS fail, adapter hit/miss, blocked, placeholder substitution count, escrow ops, p50/p99 latencies, API requests), a Runtime boundaries table summarising what is mediated where, a Health table per component, and an Operating mode card with three buttons: Discovery, Shadow, Enforcement.
| Action | RBAC |
|---|---|
| Read everything | viewer |
| Switch mode | admin |
Sessions — /dashboard/sessions
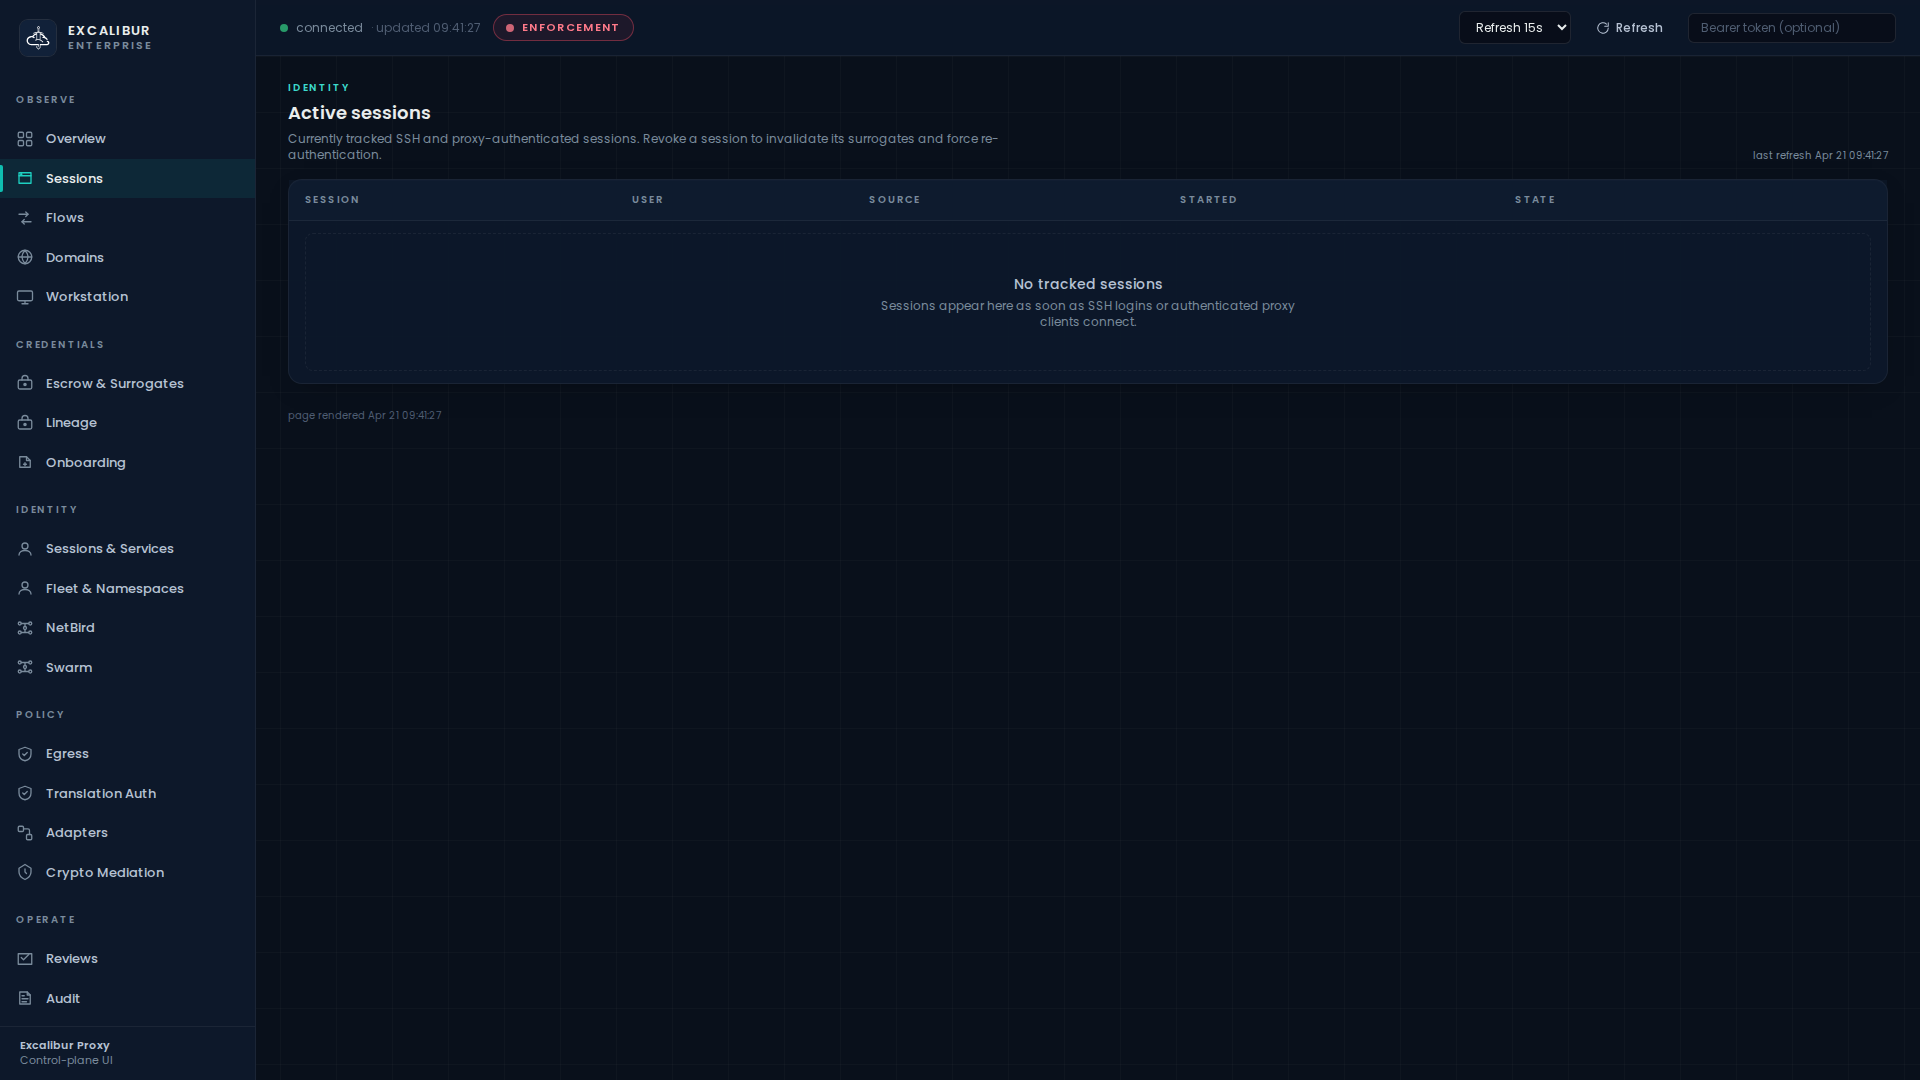
Single table titled Active sessions with columns Session, User, Source, Started, State, plus a Revoke column.
| Action | RBAC |
|---|---|
| Read | operator |
| Revoke session | admin |
Flows — /dashboard/flows
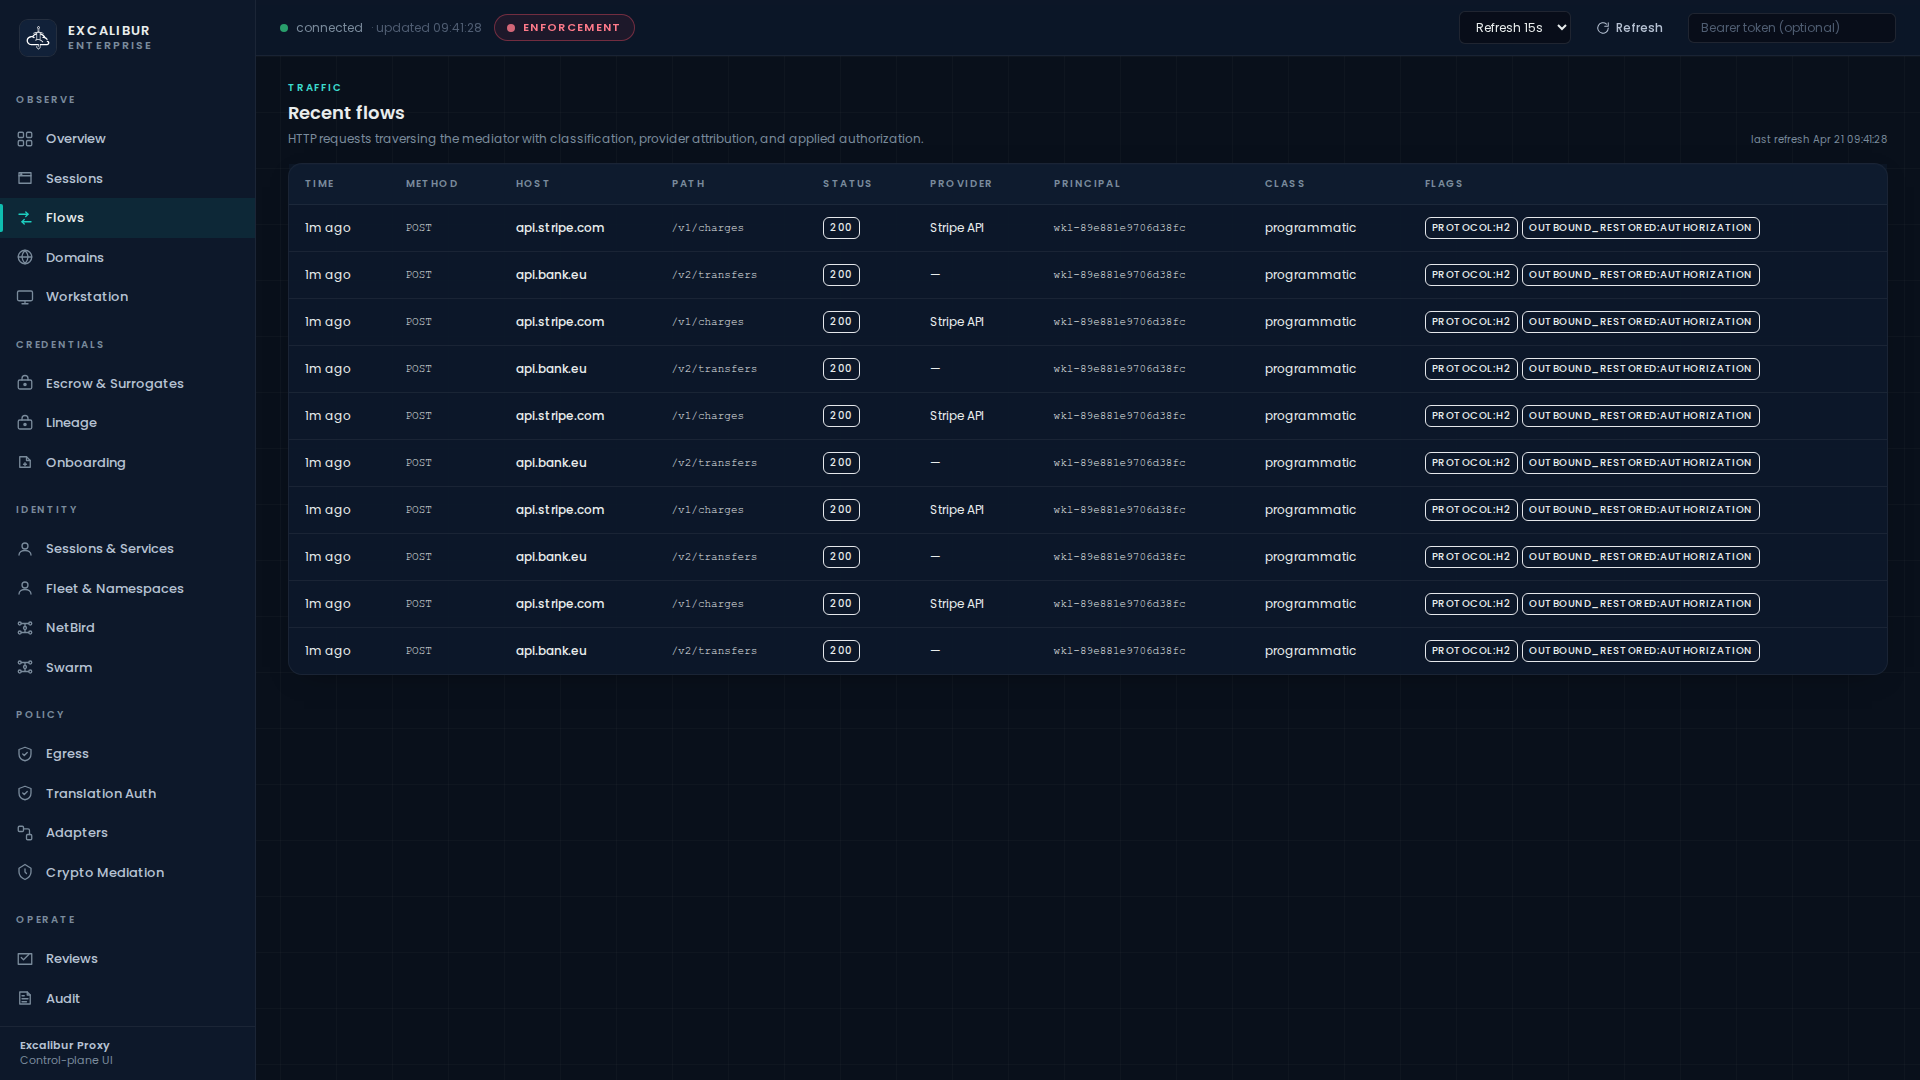
The single most operationally-useful page. Every CONNECT or plain HTTP flow streams in with columns Time, Method, Host, Path, Status, Provider, Principal, Class, Flags.
| Action | RBAC |
|---|---|
| Read | operator |
Domains — /dashboard/domains
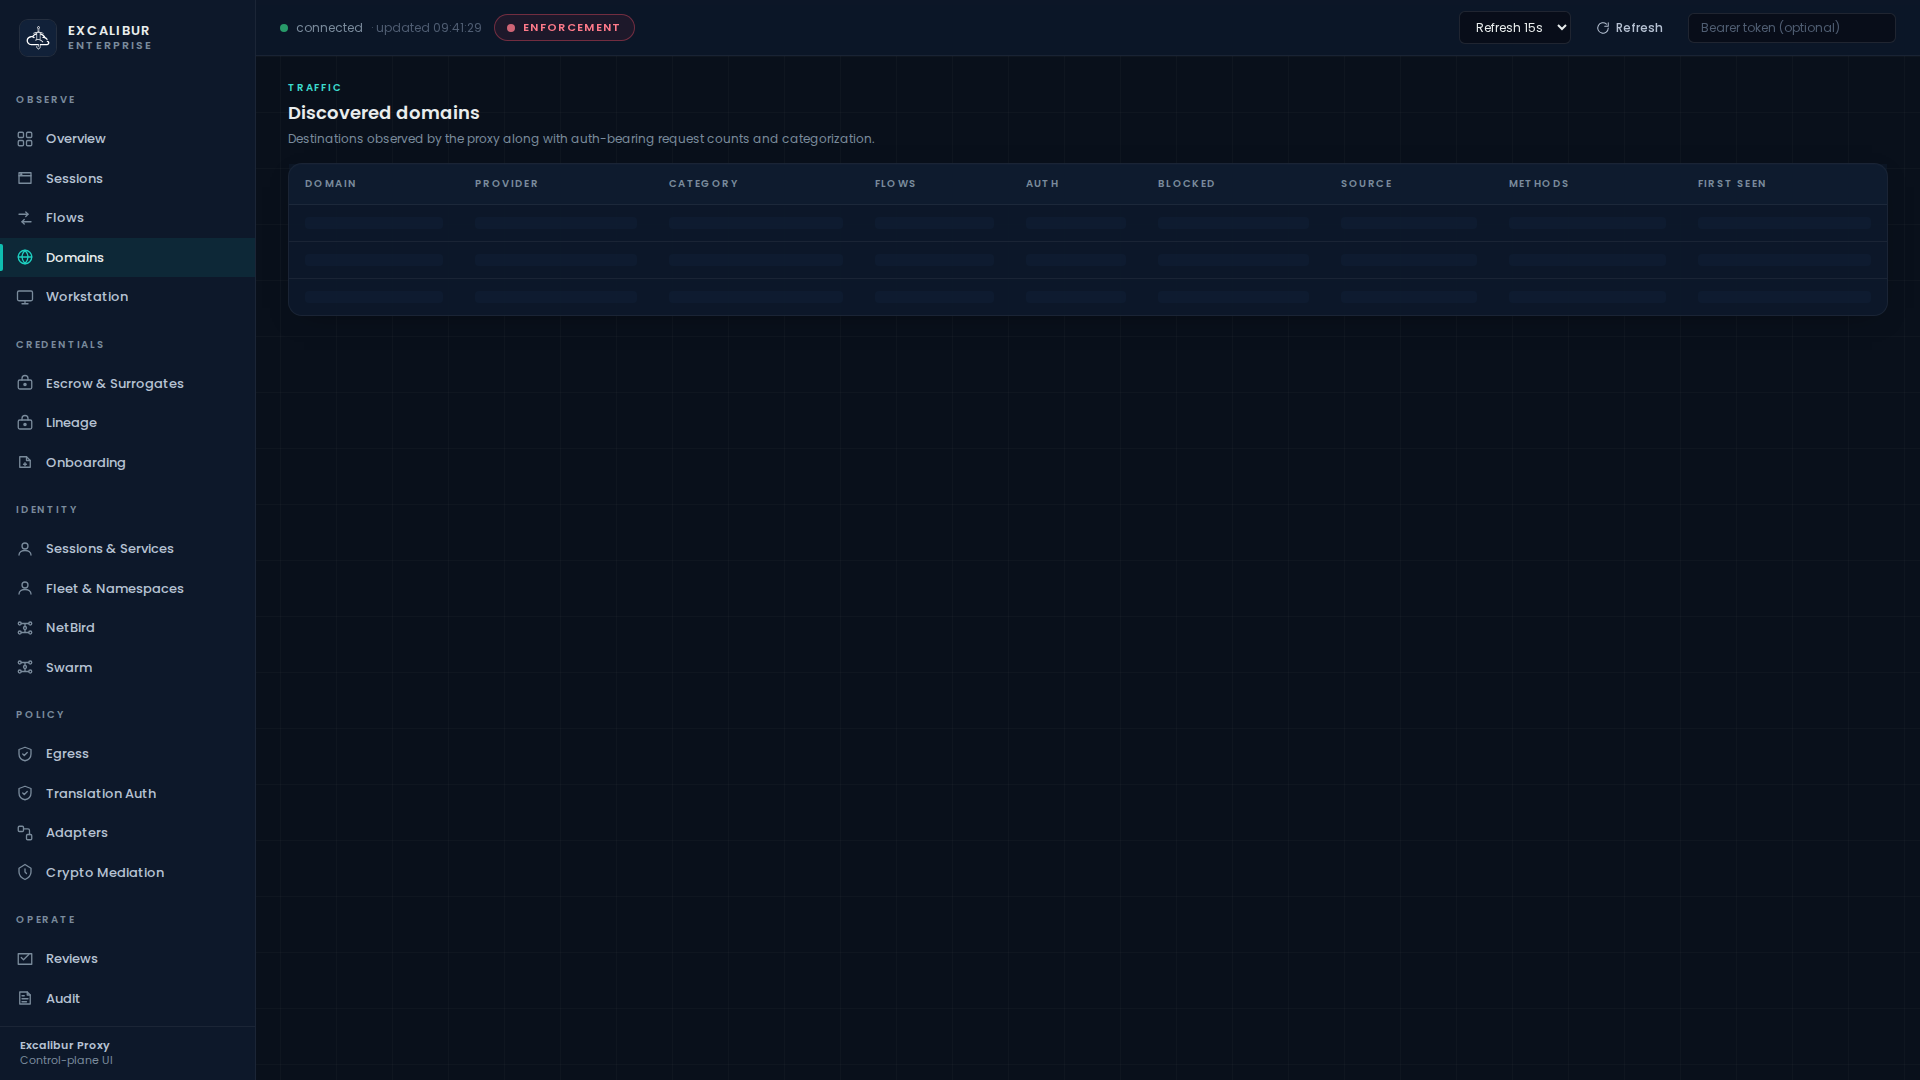
Discovered domains table: Domain, Provider, Category, Flows, Auth, Blocked, Source, Methods, First seen.
| Action | RBAC |
|---|---|
| Read | operator |
Workstation — /dashboard/workstation
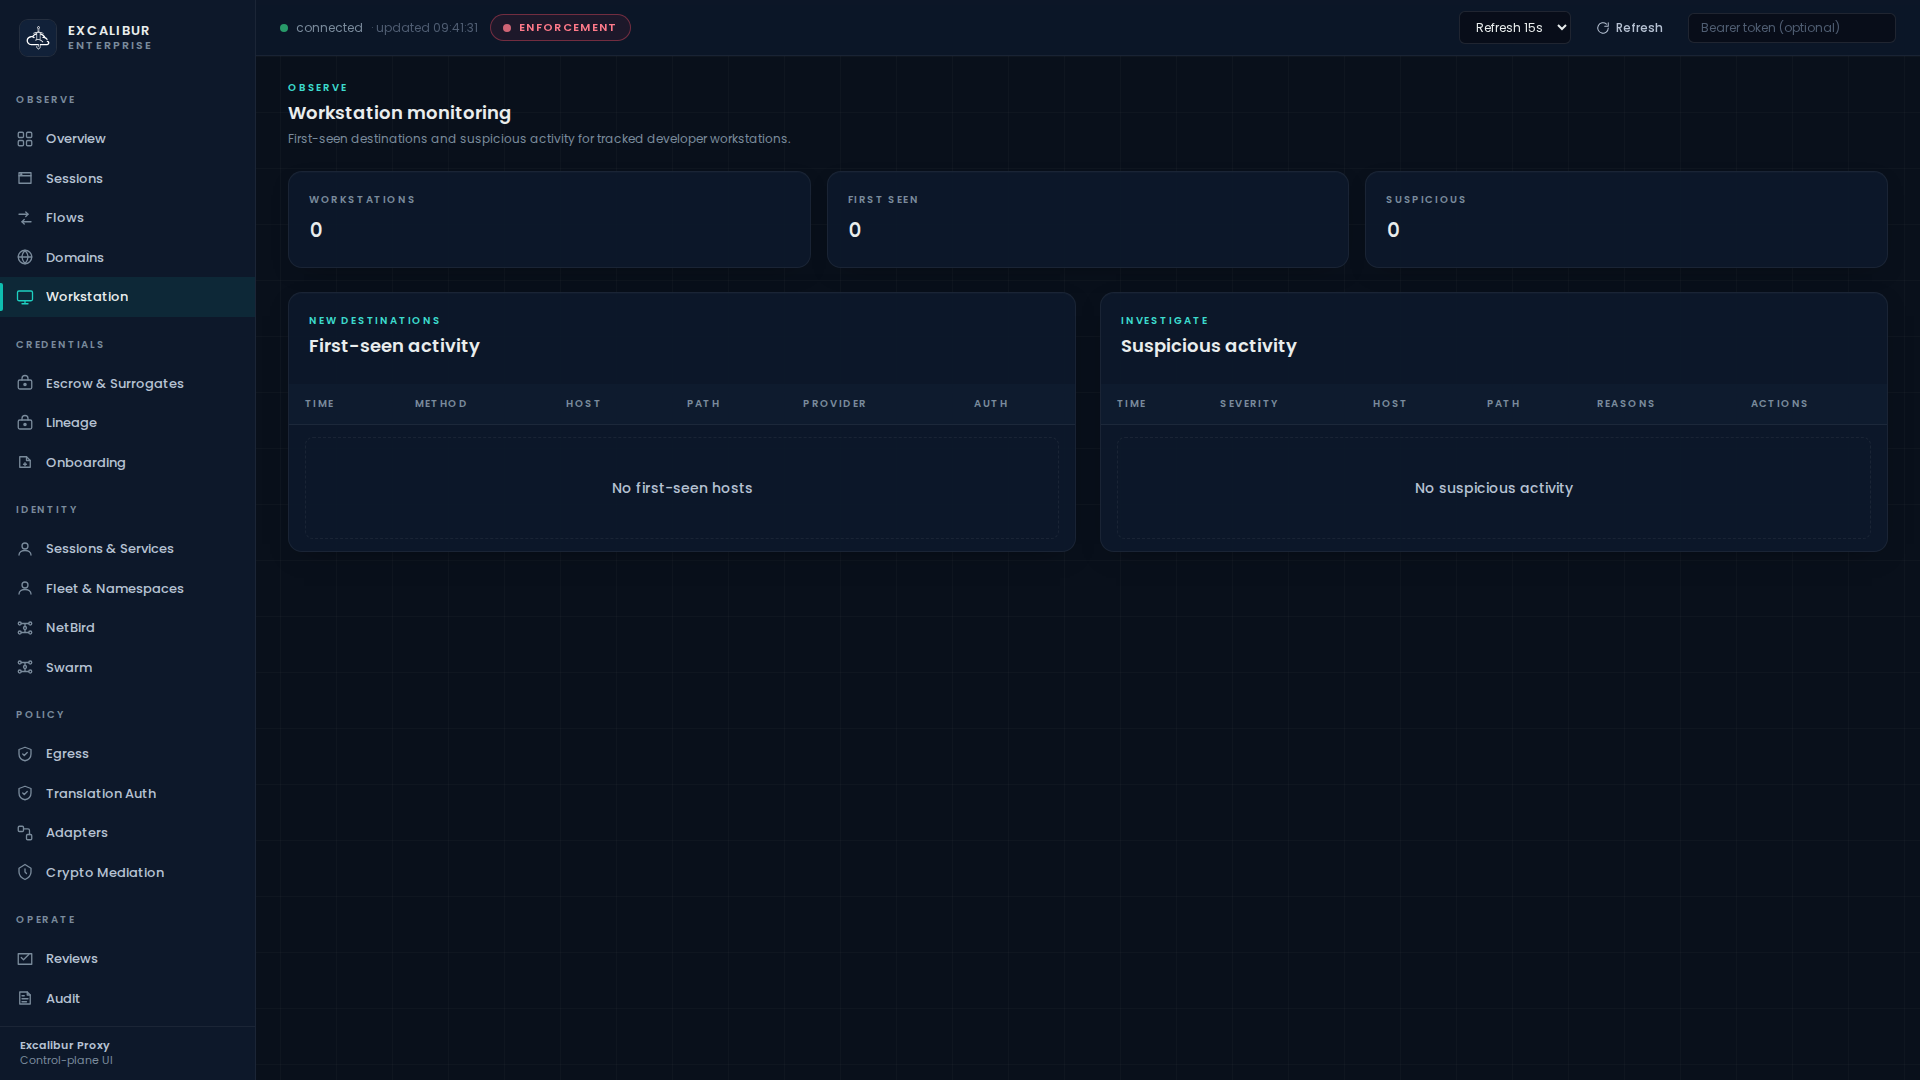
KPI strip (workstations, first-seen, suspicious) plus two tables:
- First-seen activity — Time, Method, Host, Path, Provider, Auth.
- Suspicious activity — Time, Severity, Host, Path, Reasons, Actions.
The Suspicious table is the primary "investigate now" surface — see Responding to an incident.
| Action | RBAC |
|---|---|
| Summary | viewer |
| Read details | operator |
Credentials
Manage the placeholder vault, escrowed credentials, active surrogates, and credential onboarding.
Escrow & Surrogates — /dashboard/credentials
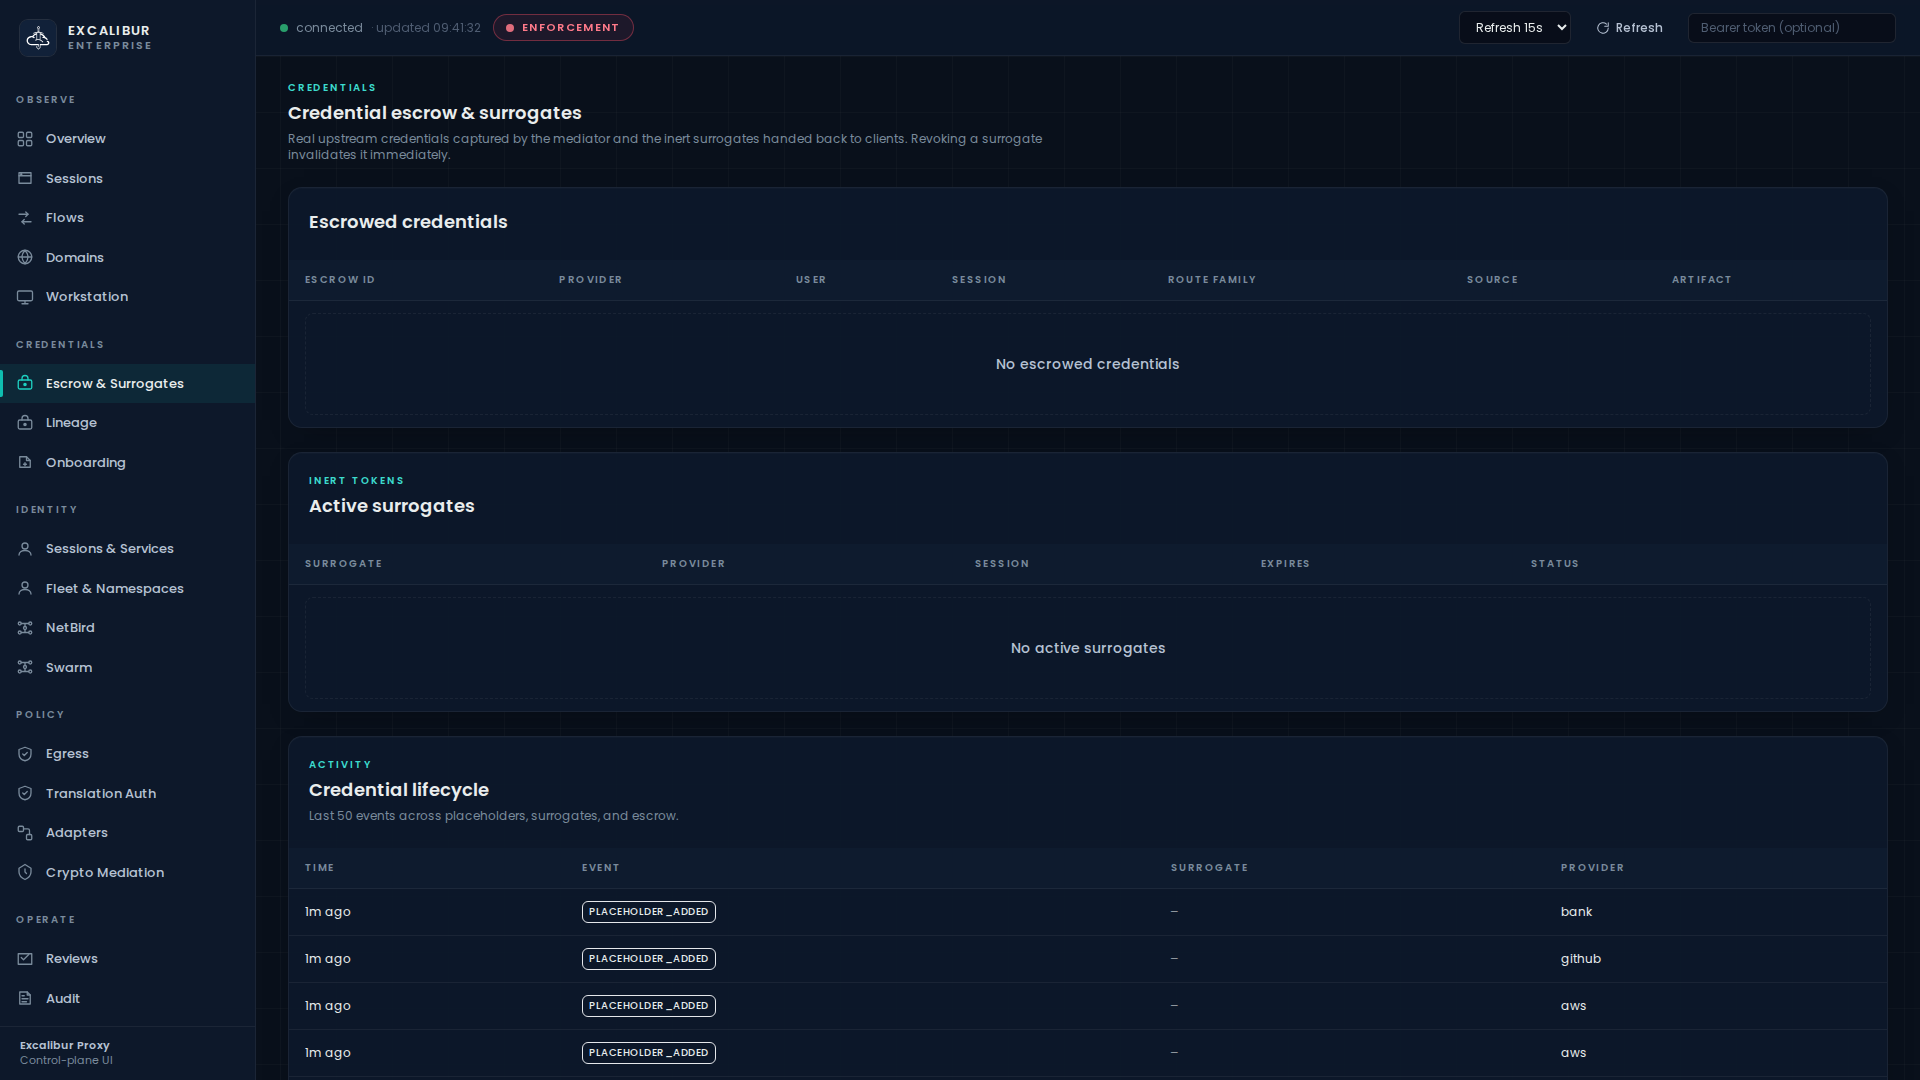
Four sections, top to bottom:
- Placeholder vault — Placeholder, Provider, Route family, Last rotated.
- Escrowed credentials — Escrow ID, Provider, User, Session, Route family, Source, Artifact.
- Active surrogates — Surrogate, Provider, Session, Expires, Status, plus Revoke.
- Credential lifecycle — Time, Event, Surrogate, Provider.
| Action | RBAC |
|---|---|
| Read | operator |
| Revoke surrogate | admin |
Lineage — /dashboard/lineage
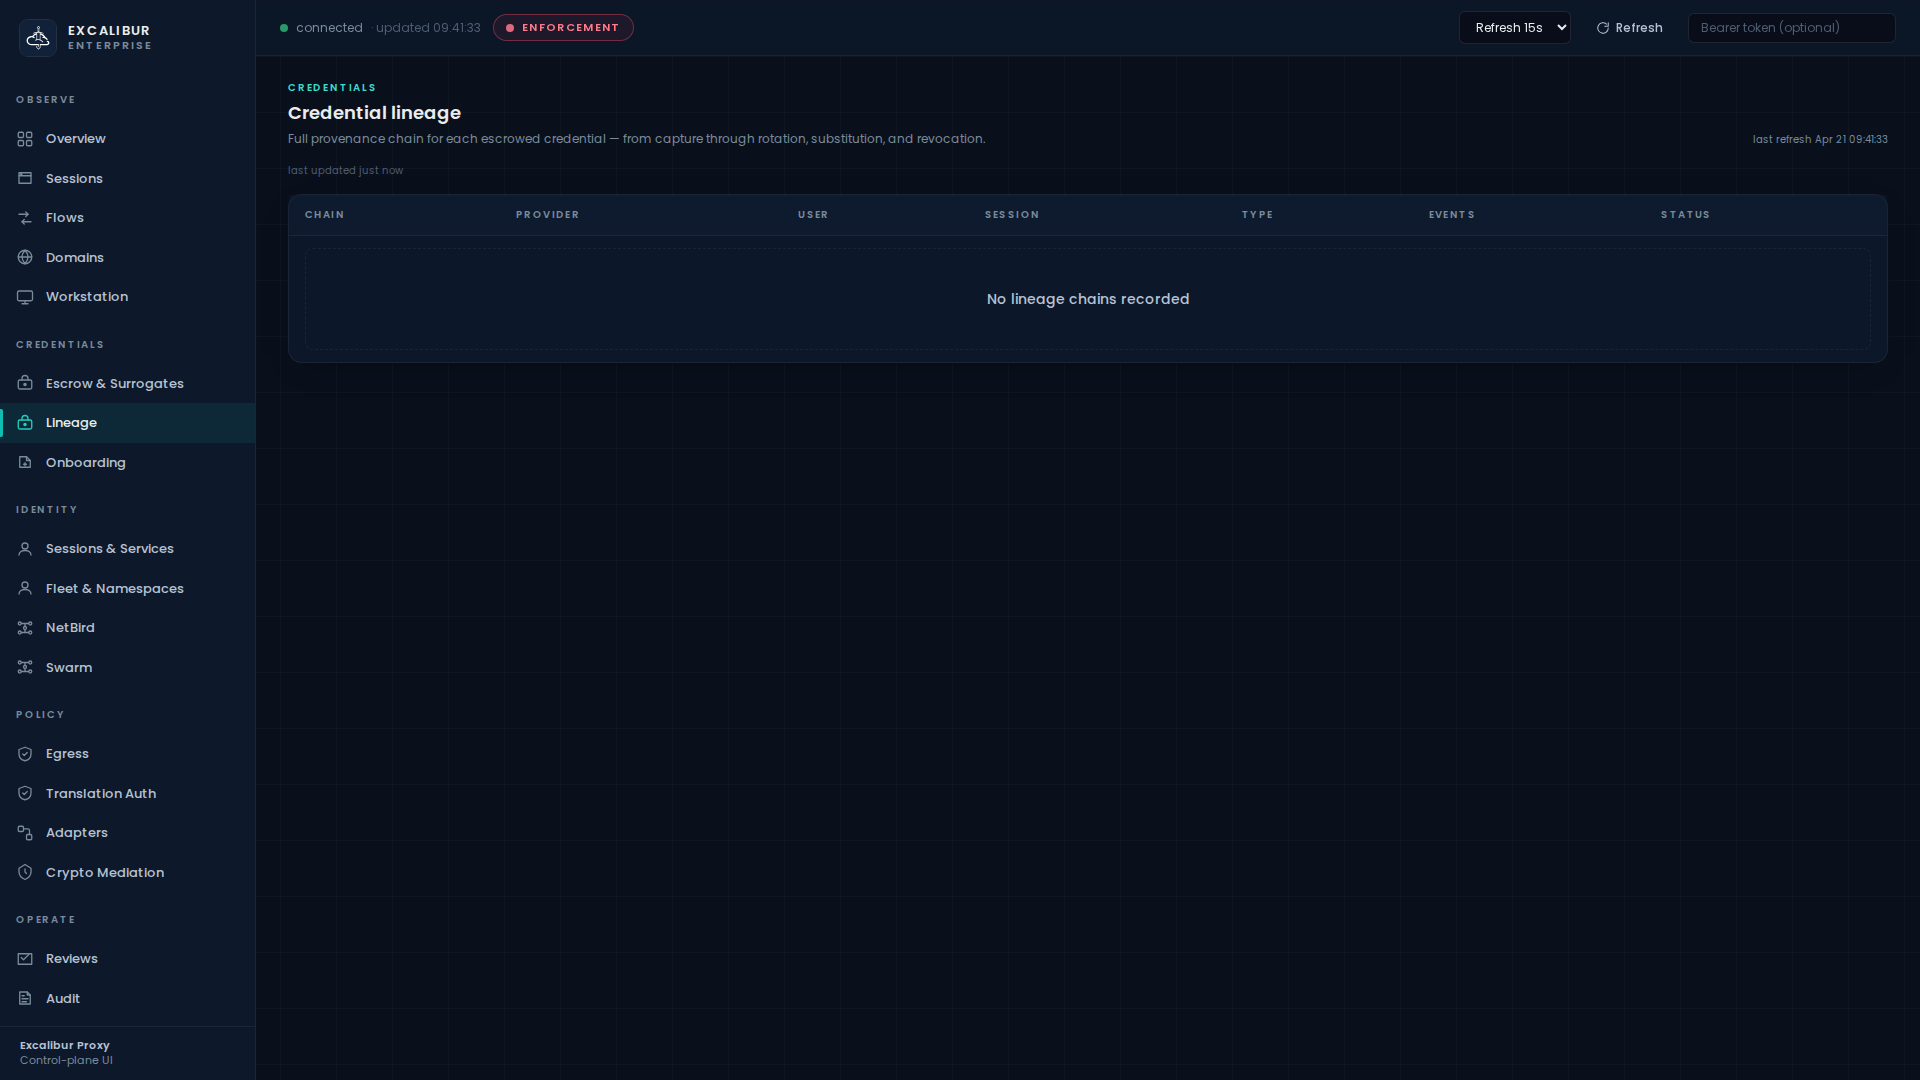
Credential lineage table: Chain, Provider, User, Session, Type, Events, Status. Each row is a derivation chain (escrow → surrogate → refresh → revocation, etc.).
| Action | RBAC |
|---|---|
| Read | operator |
Onboarding — /dashboard/onboarding
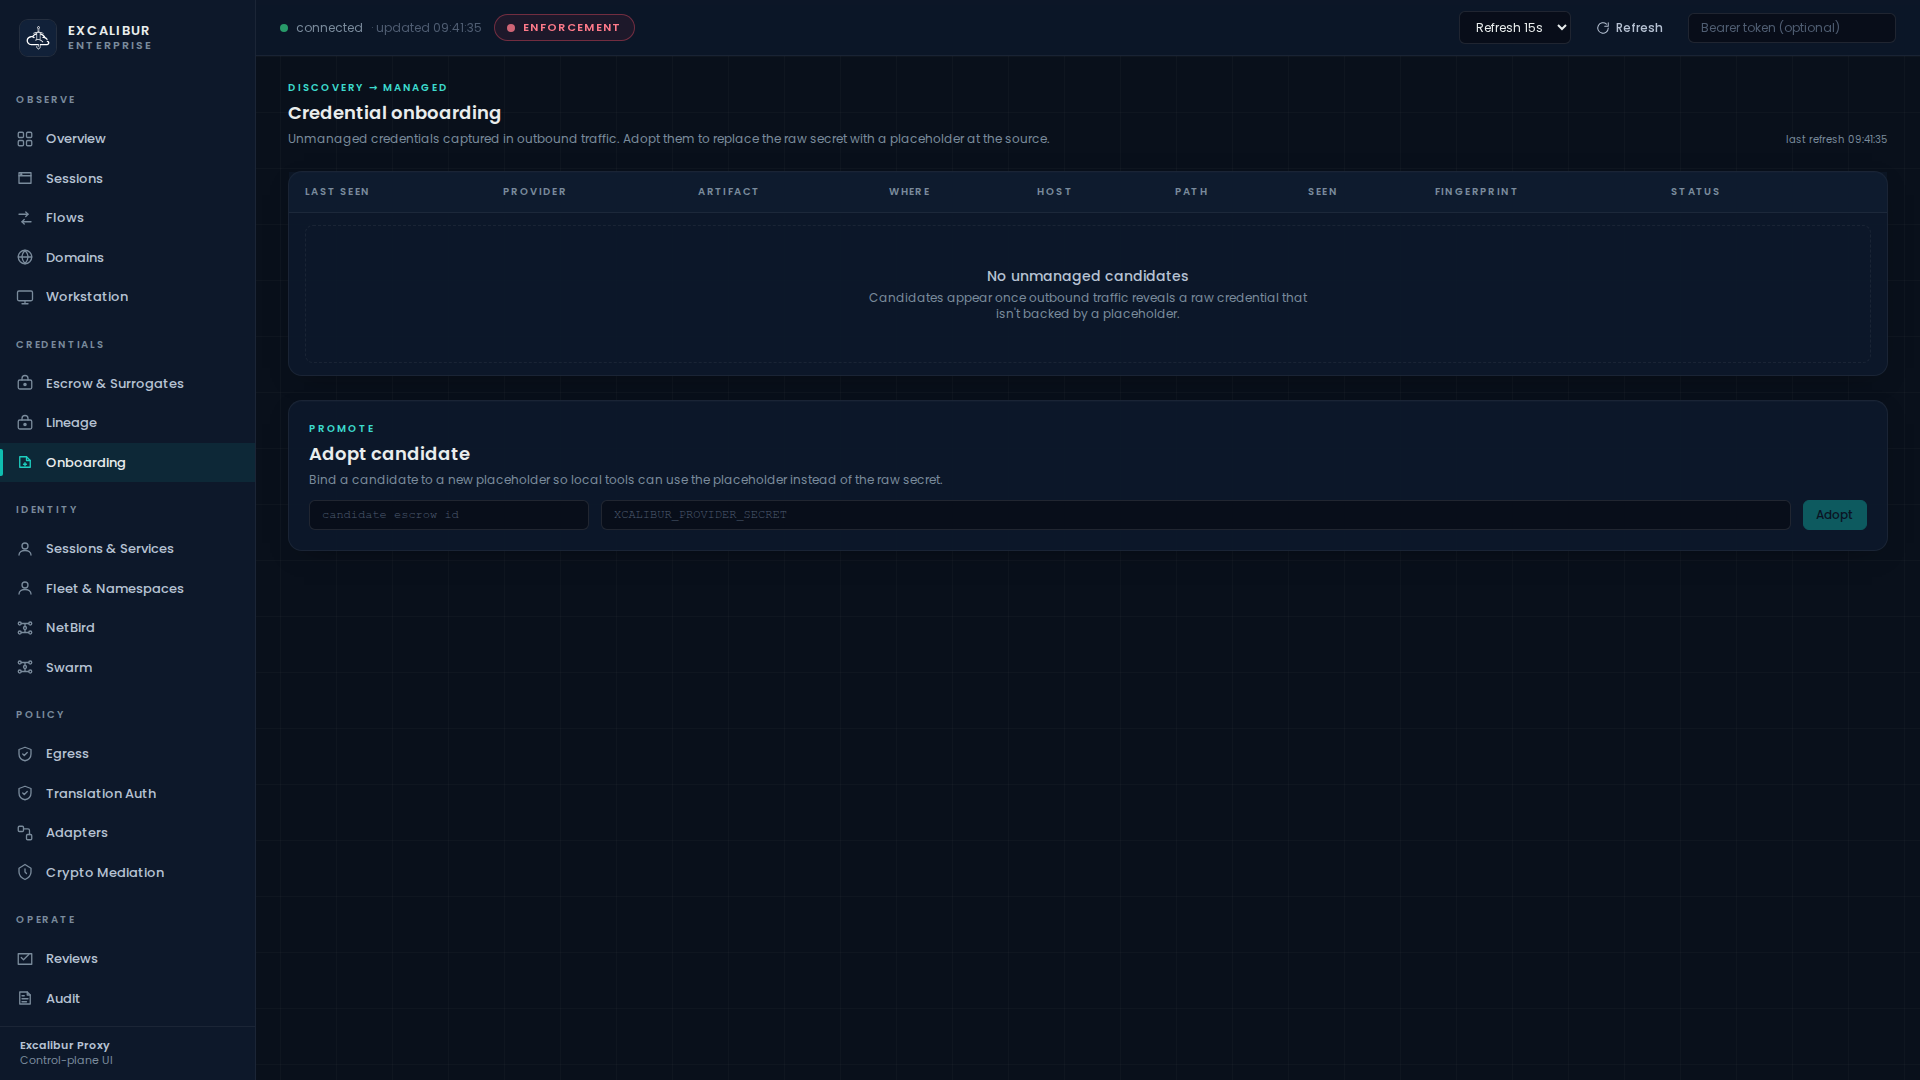
A Credential onboarding table of unmanaged candidates and an Adopt candidate form below — see Onboarding a credential.
| Action | RBAC |
|---|---|
| Read | operator |
| Adopt | operator |
Identity
Proxy identities, service credentials, fleet workloads, and overlay network peers.
Sessions & Services — /dashboard/identity
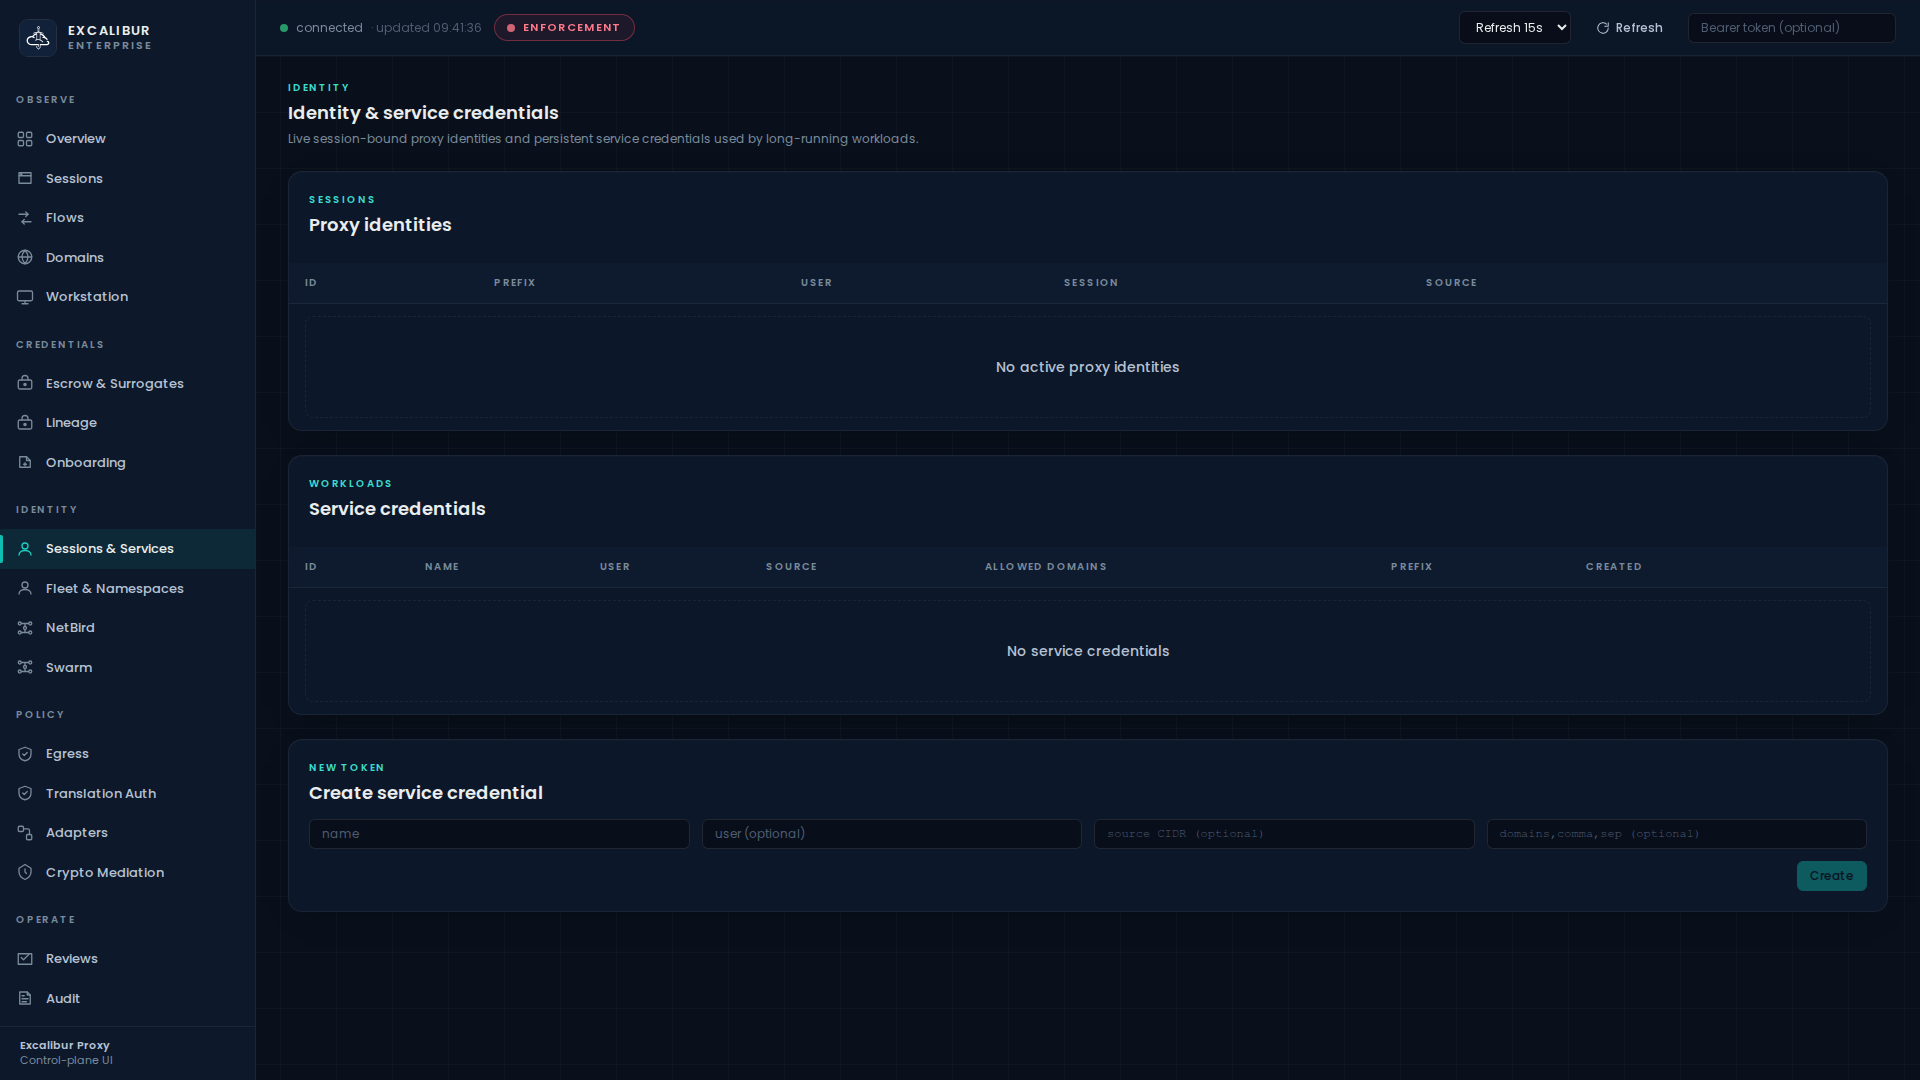
Three sections:
- Proxy identities — ID, Prefix, User, Session, Source, Revoke.
- Service credentials — ID, Name, User, Source, Allowed domains, Prefix, Created, Delete.
- Create service credential — name / user / source CIDR / domains form + Create button.
| Action | RBAC |
|---|---|
| Read tables | operator |
| Create / delete service cred | admin |
| Revoke proxy identity | admin |
Fleet & Namespaces — /dashboard/fleet
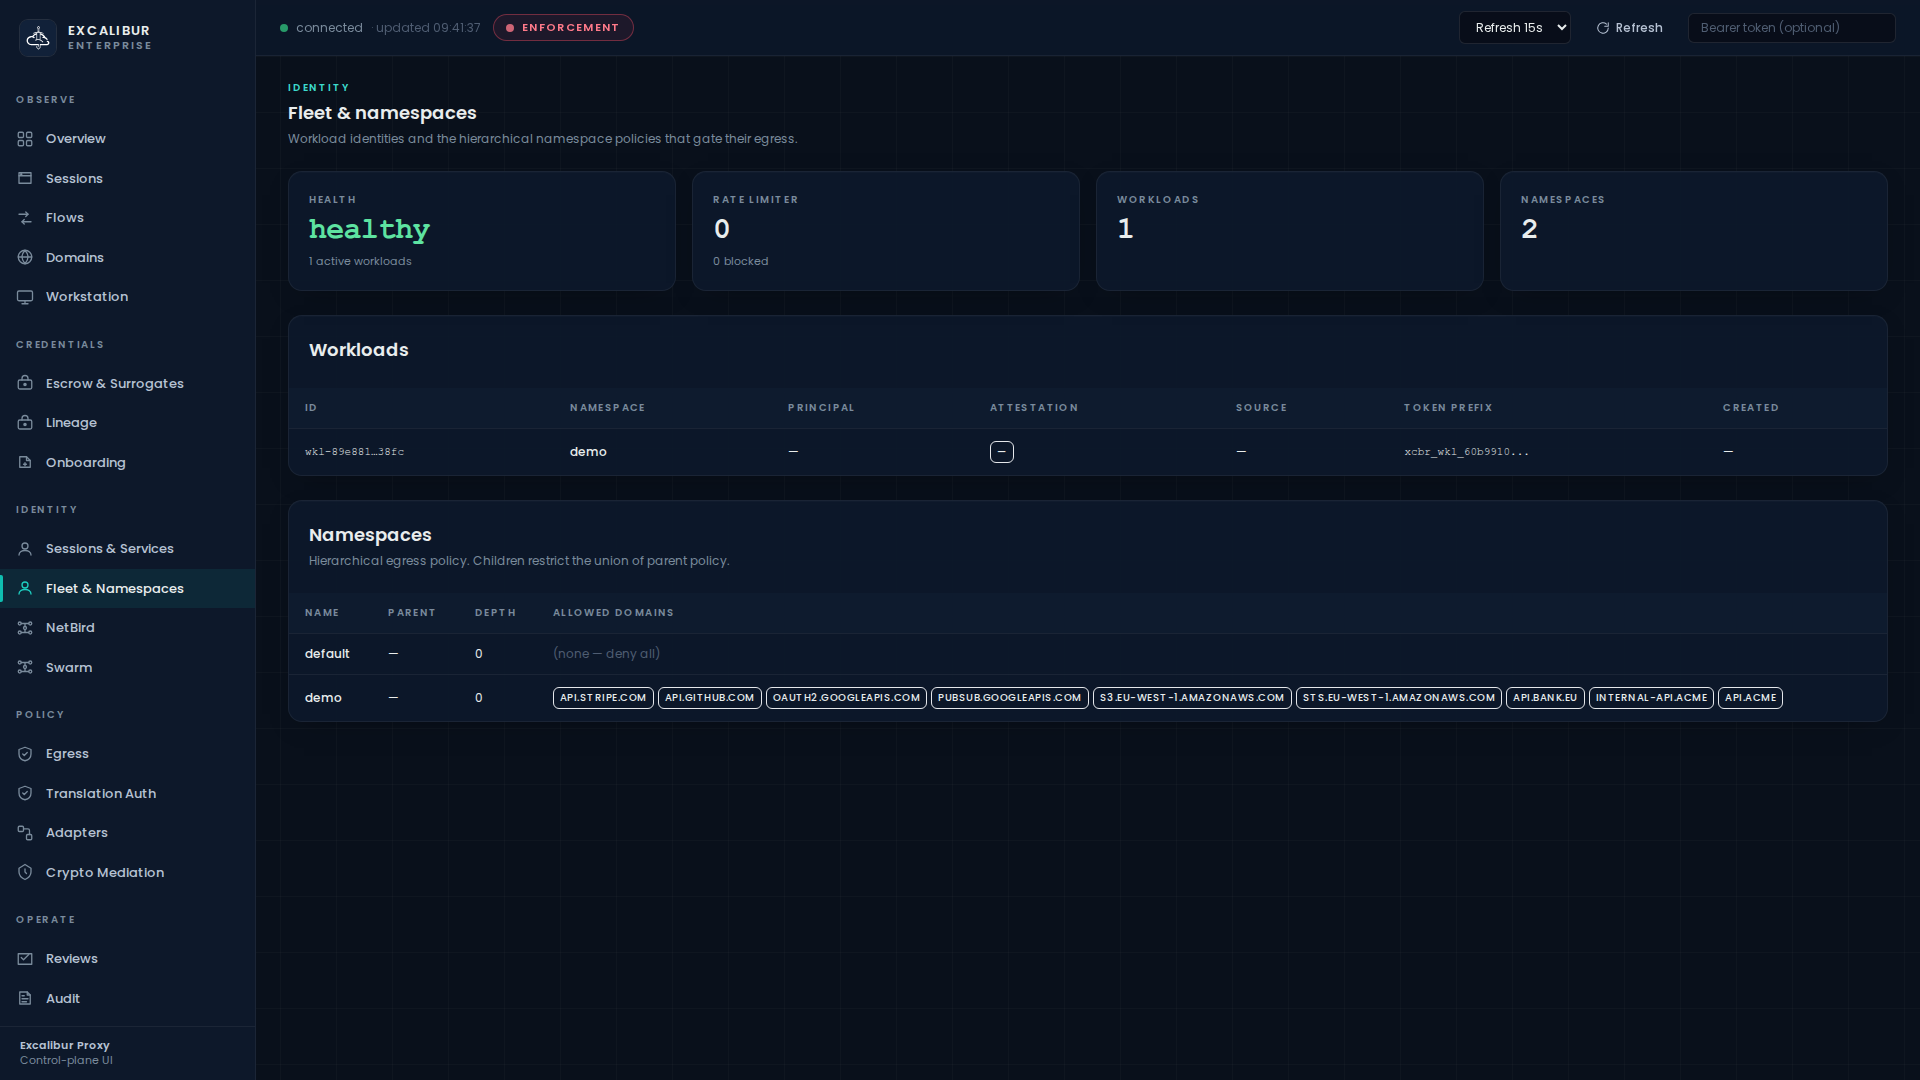
KPI cards (Health, Rate limiter, Workloads, Namespaces) plus two tables:
- Workloads — ID, Namespace, Principal, Attestation, Source, Token prefix, Created.
- Namespaces — Name, Parent, Depth, Allowed domains.
| Action | RBAC |
|---|---|
| Health, rate limiter | viewer |
| Workloads, namespaces | operator |
Namespace mutations are admin-only via API — see Egress & namespace policy.
NetBird — /dashboard/netbird
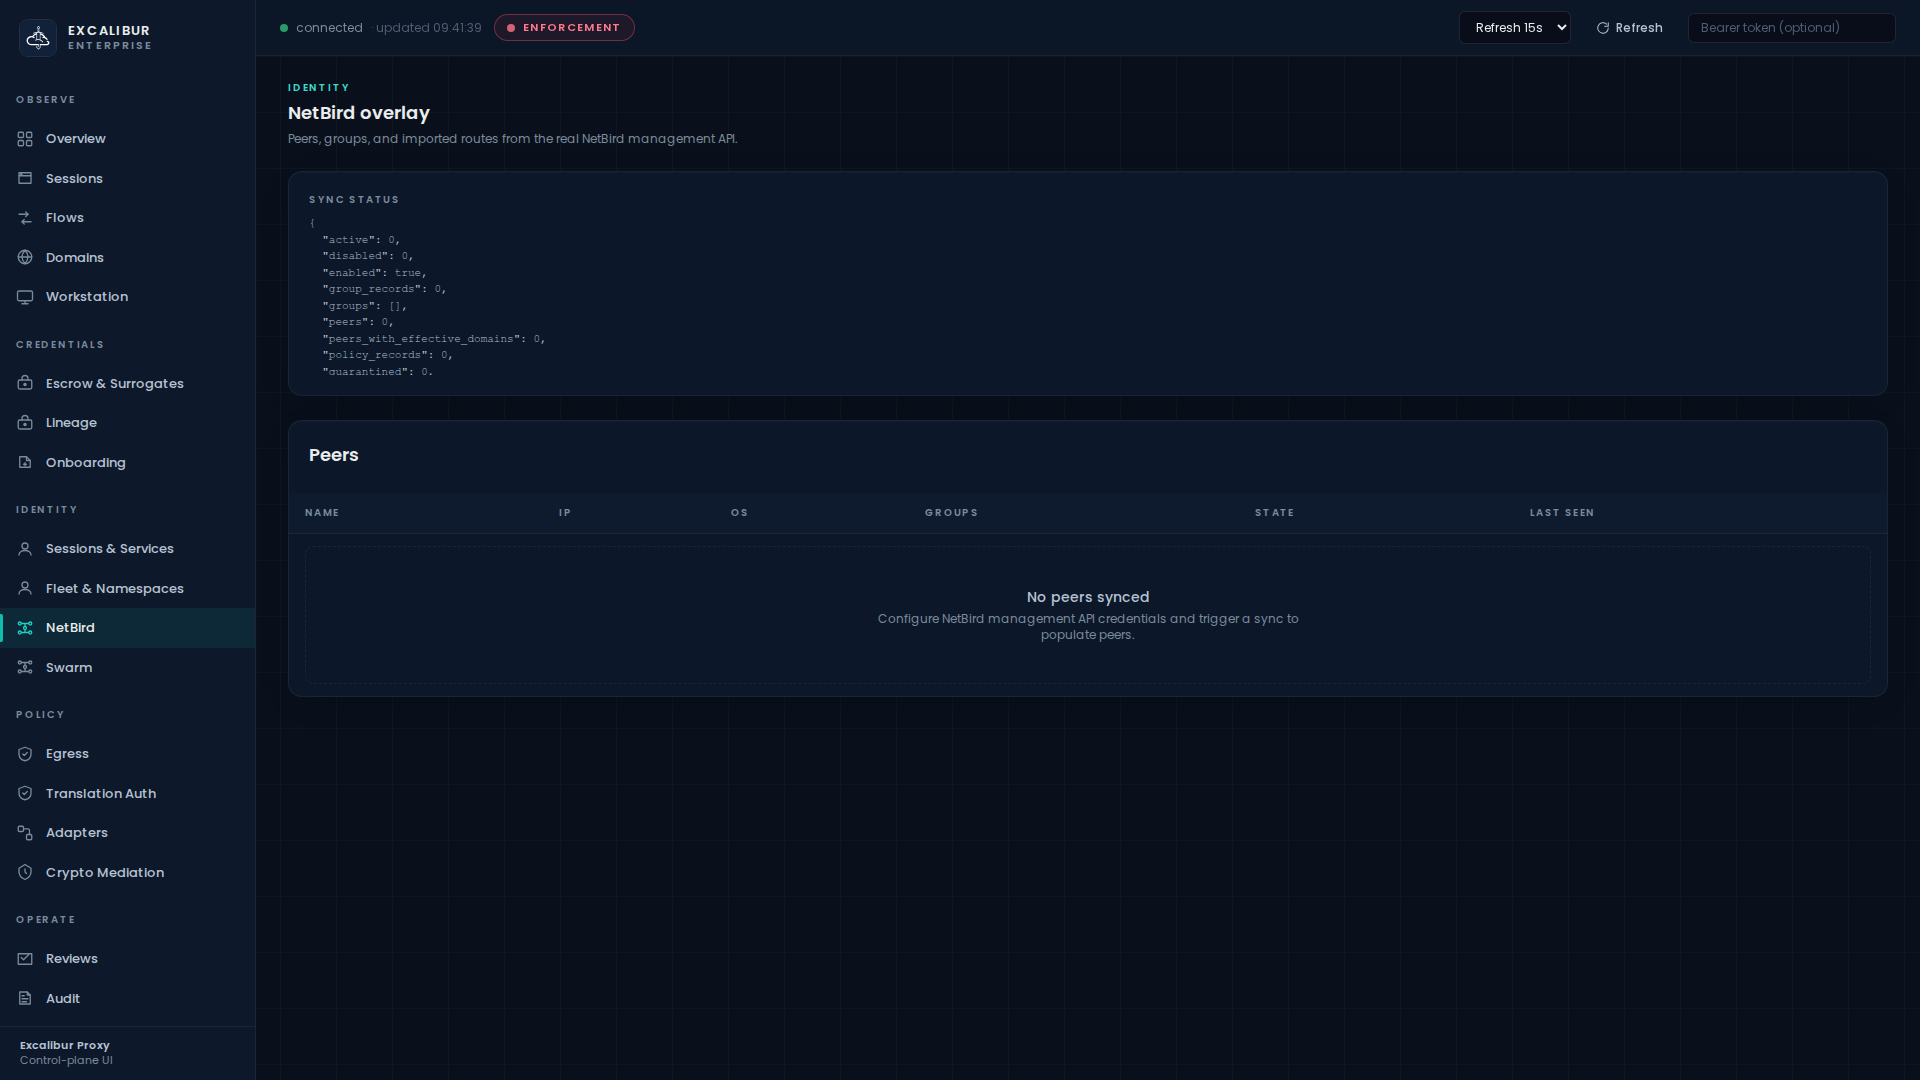
Sync status JSON card and a Peers table with Name, IP, OS, Groups, State, Last seen.
| Action | RBAC |
|---|---|
| Status | viewer |
| Peers | operator |
Swarm — /dashboard/swarm
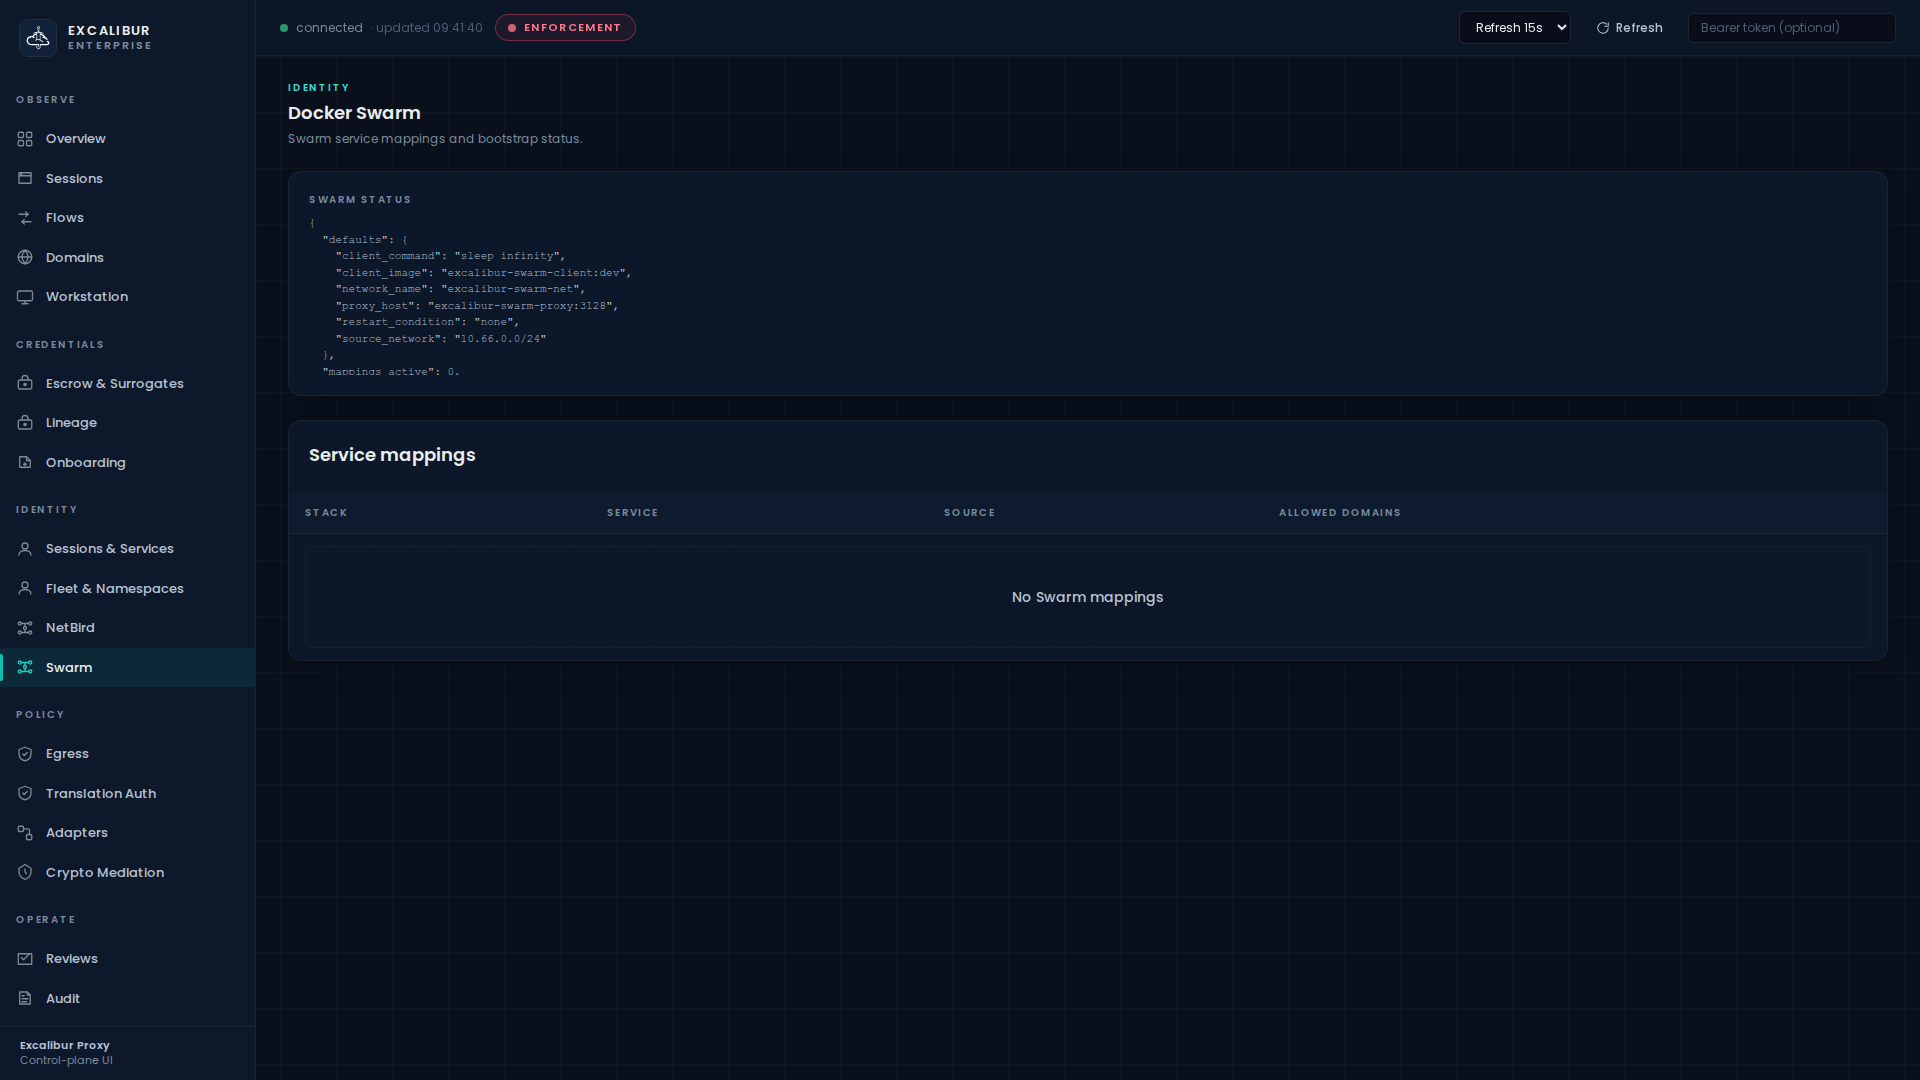
Swarm status JSON card and a Service mappings table with Stack, Service, Source, Allowed domains.
| Action | RBAC |
|---|---|
| Status | viewer |
| Mappings | operator |
Policy
Egress rules, translation authorisation, adapters, and cryptographic mediation mappings.
Egress — /dashboard/policy/egress
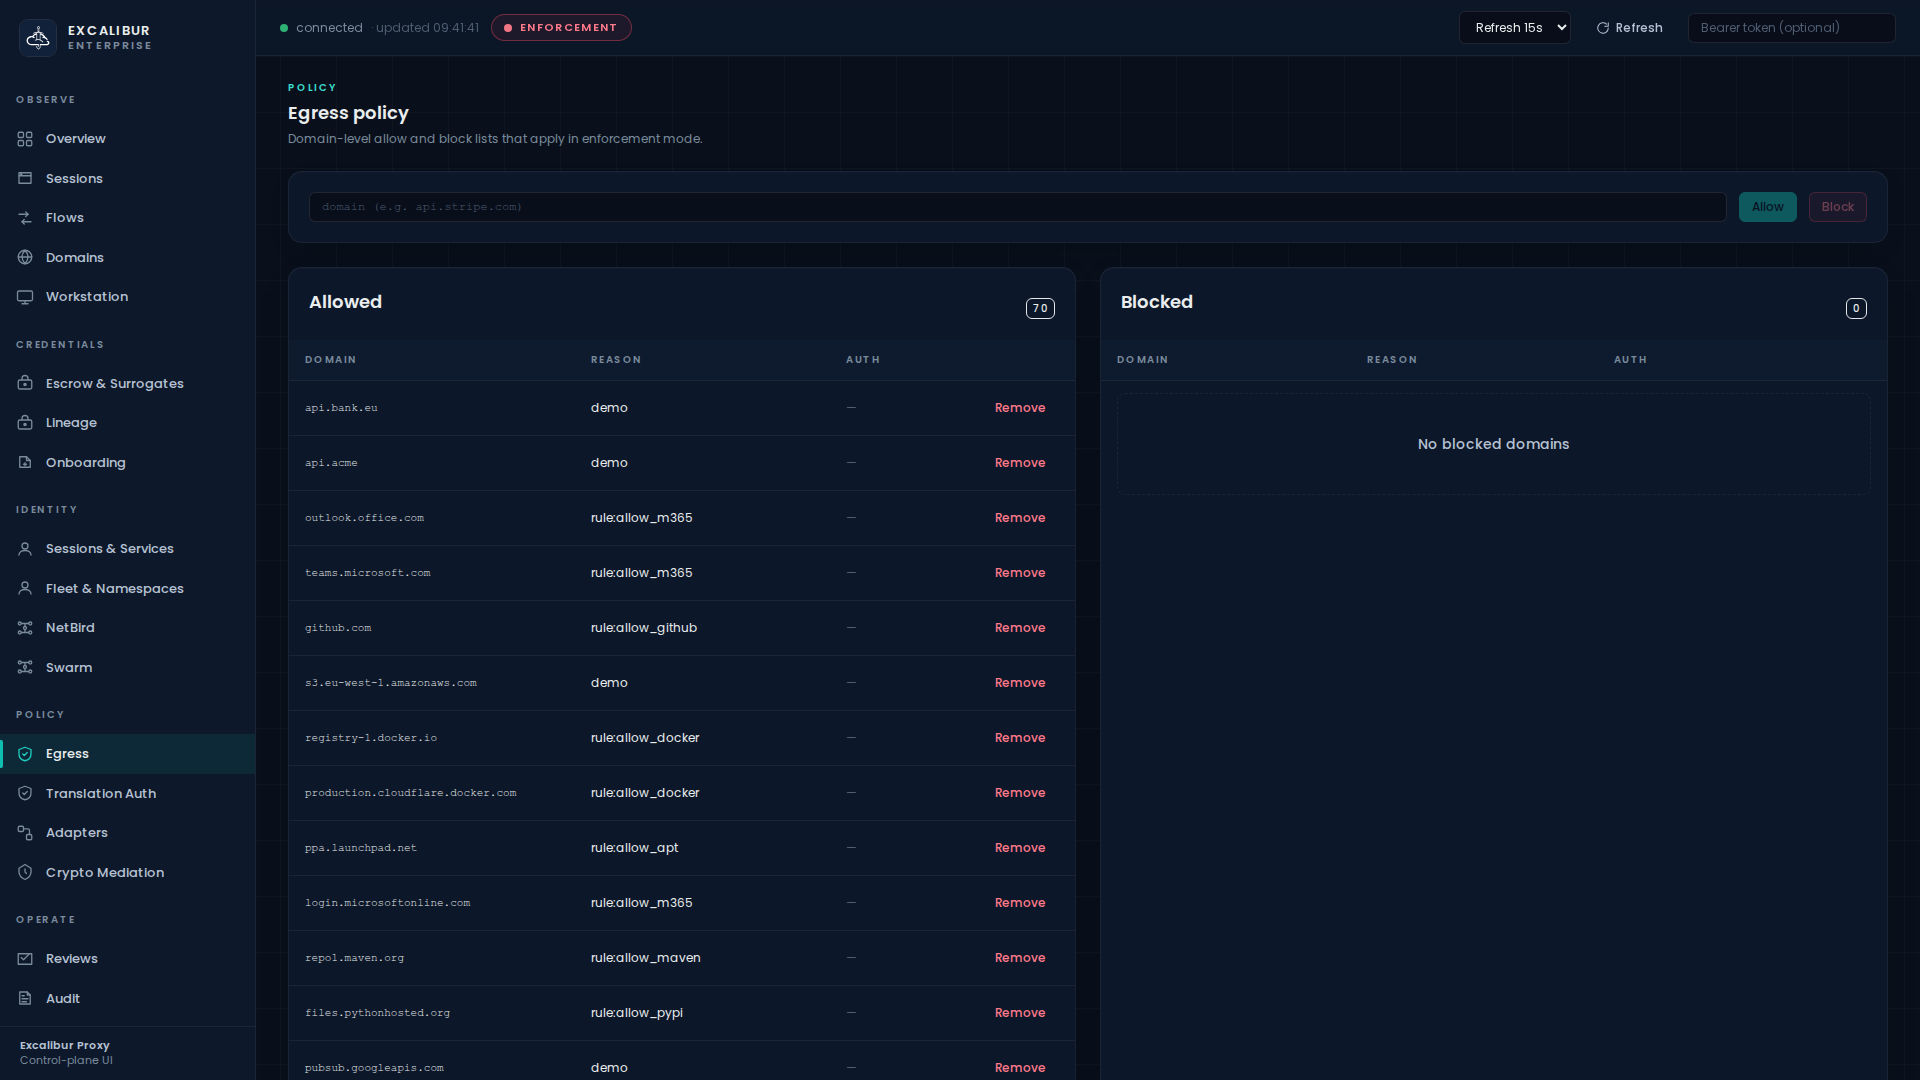
Domain input + Allow / Block buttons, then side-by-side Allowed and Blocked tables.
| Action | RBAC |
|---|---|
| Read inventory | operator |
| Allow / block / remove a domain | operator |
Translation Auth — /dashboard/policy/translation
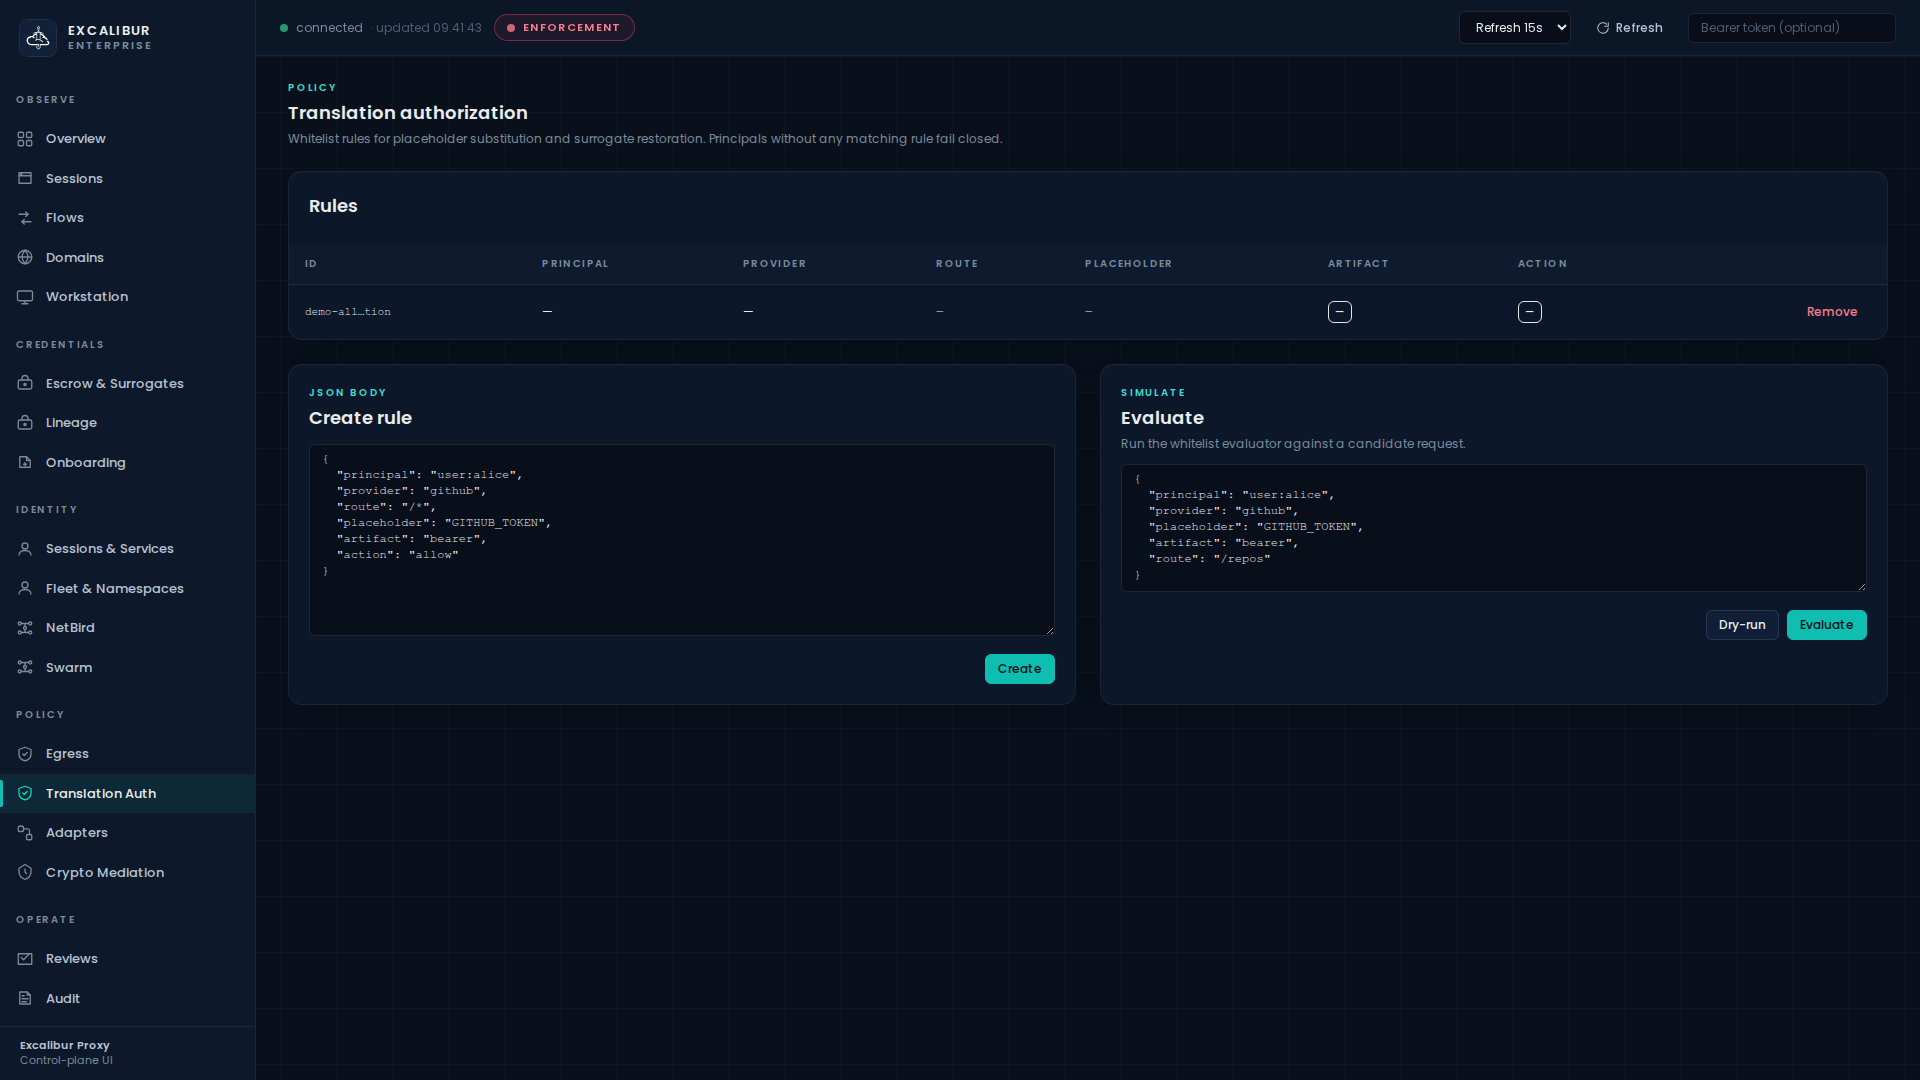
Rules table, Create rule JSON editor, Evaluate JSON editor with Dry-run and Evaluate buttons.
| Action | RBAC |
|---|---|
| Read rules | operator |
| Dry-run / evaluate | operator |
| Create / delete rule | admin |
Adapters — /dashboard/adapters
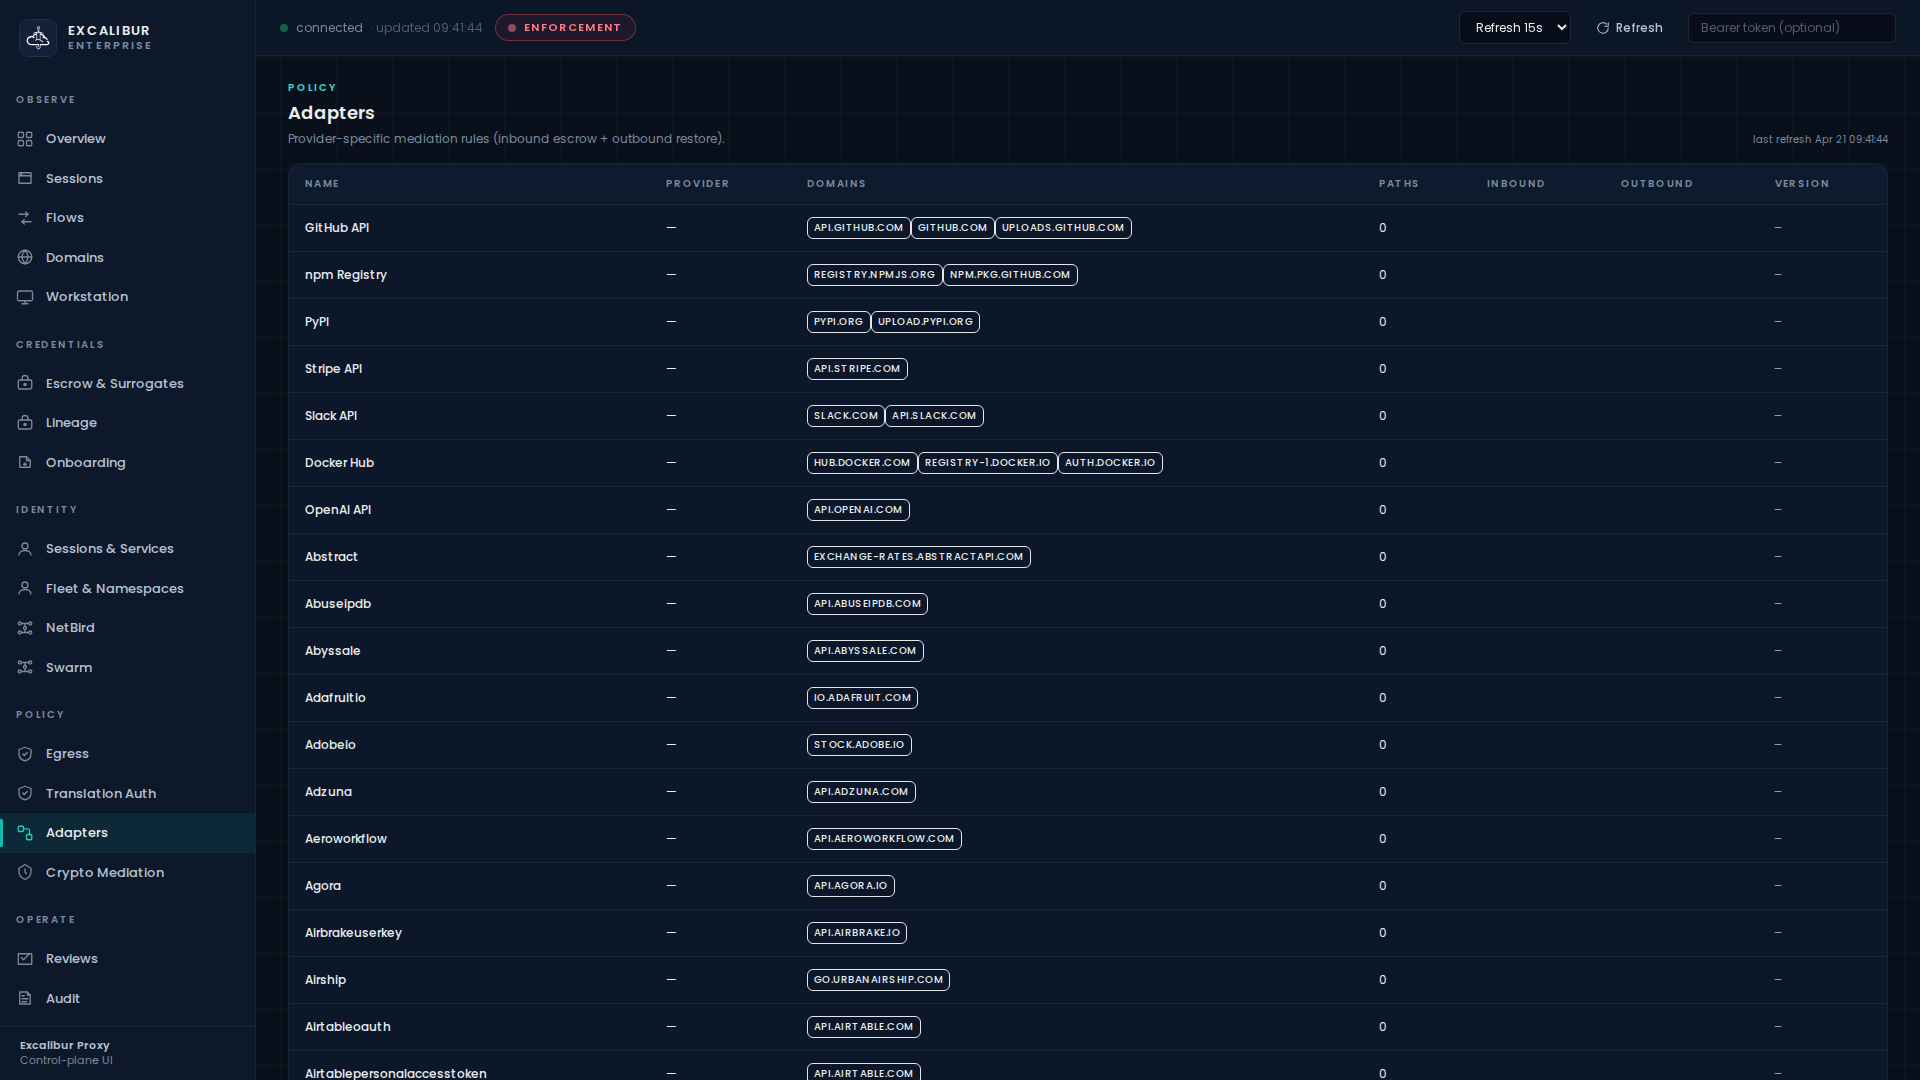
Adapters table: Name, Provider, Domains, Paths, Inbound, Outbound, Version. Excalibur ships with 730+ built-in adapters covering major SaaS, infrastructure, and developer-tooling endpoints.
| Action | RBAC |
|---|---|
| Read | operator |
Crypto Mediation — /dashboard/crypto
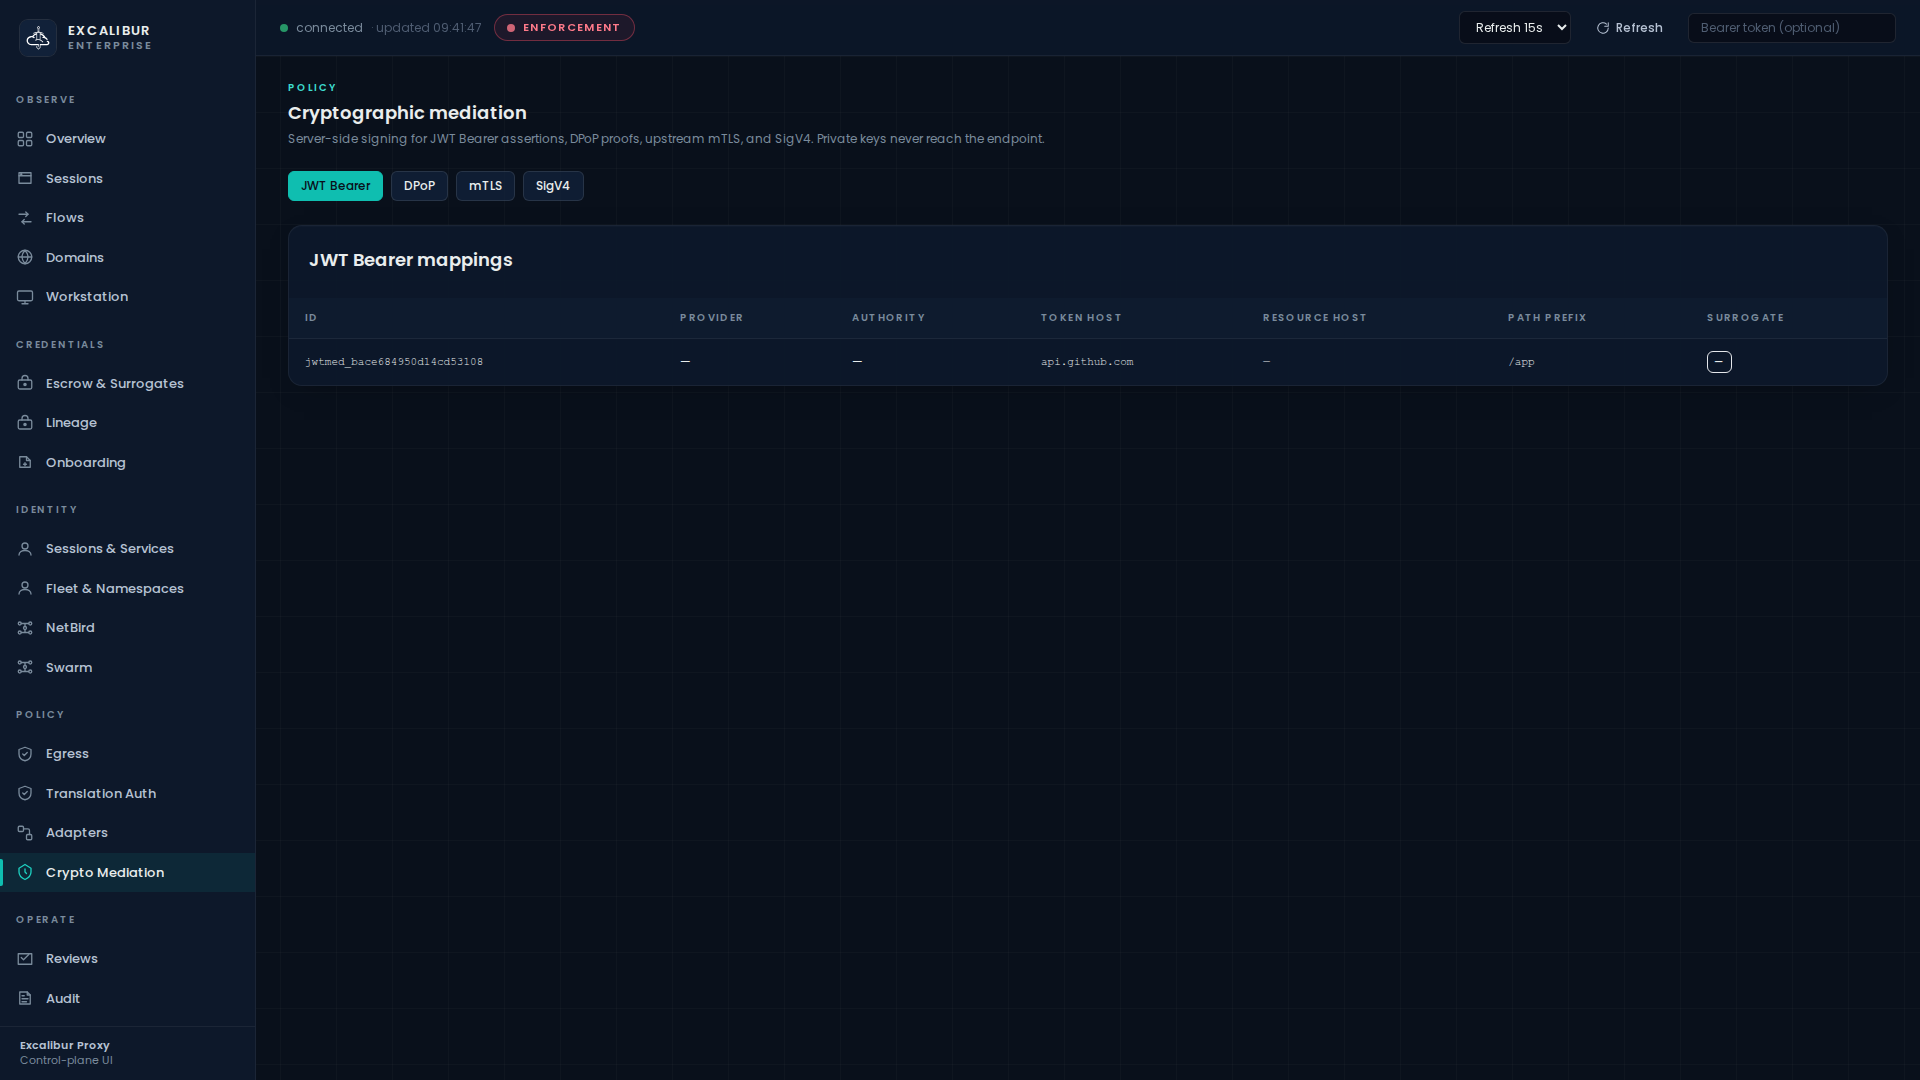
Tabbed: JWT Bearer, DPoP, mTLS, SigV4. Each tab shows a mappings table — see Cryptographic mediation.
| Action | RBAC |
|---|---|
| Read | operator |
| Write | admin (via API; UI is read-only) |
Operate
Reviews, audit trail, threat intelligence, and runtime operations.
Reviews — /dashboard/reviews
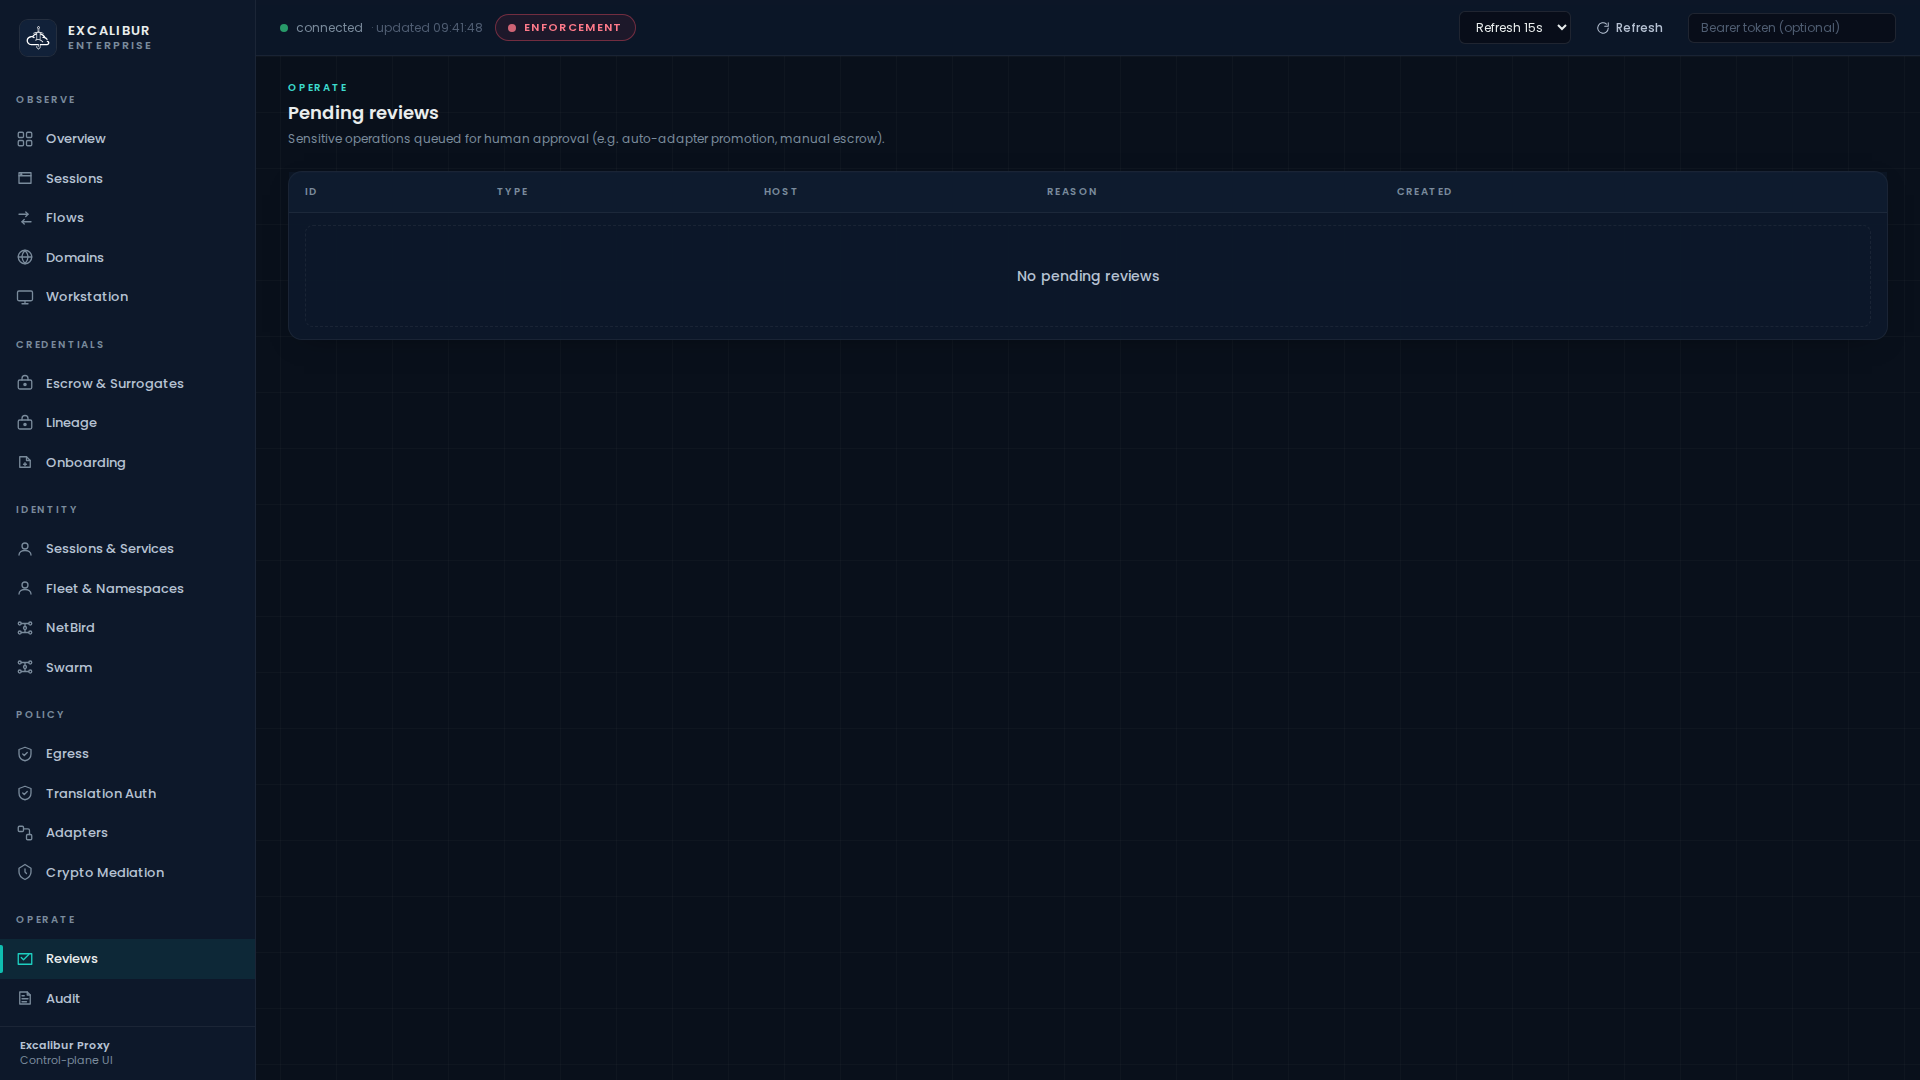
Pending reviews table: ID, Type, Host, Reason, Created, plus Approve / Deny buttons.
| Action | RBAC |
|---|---|
| List + decide | operator |
Audit — /dashboard/audit
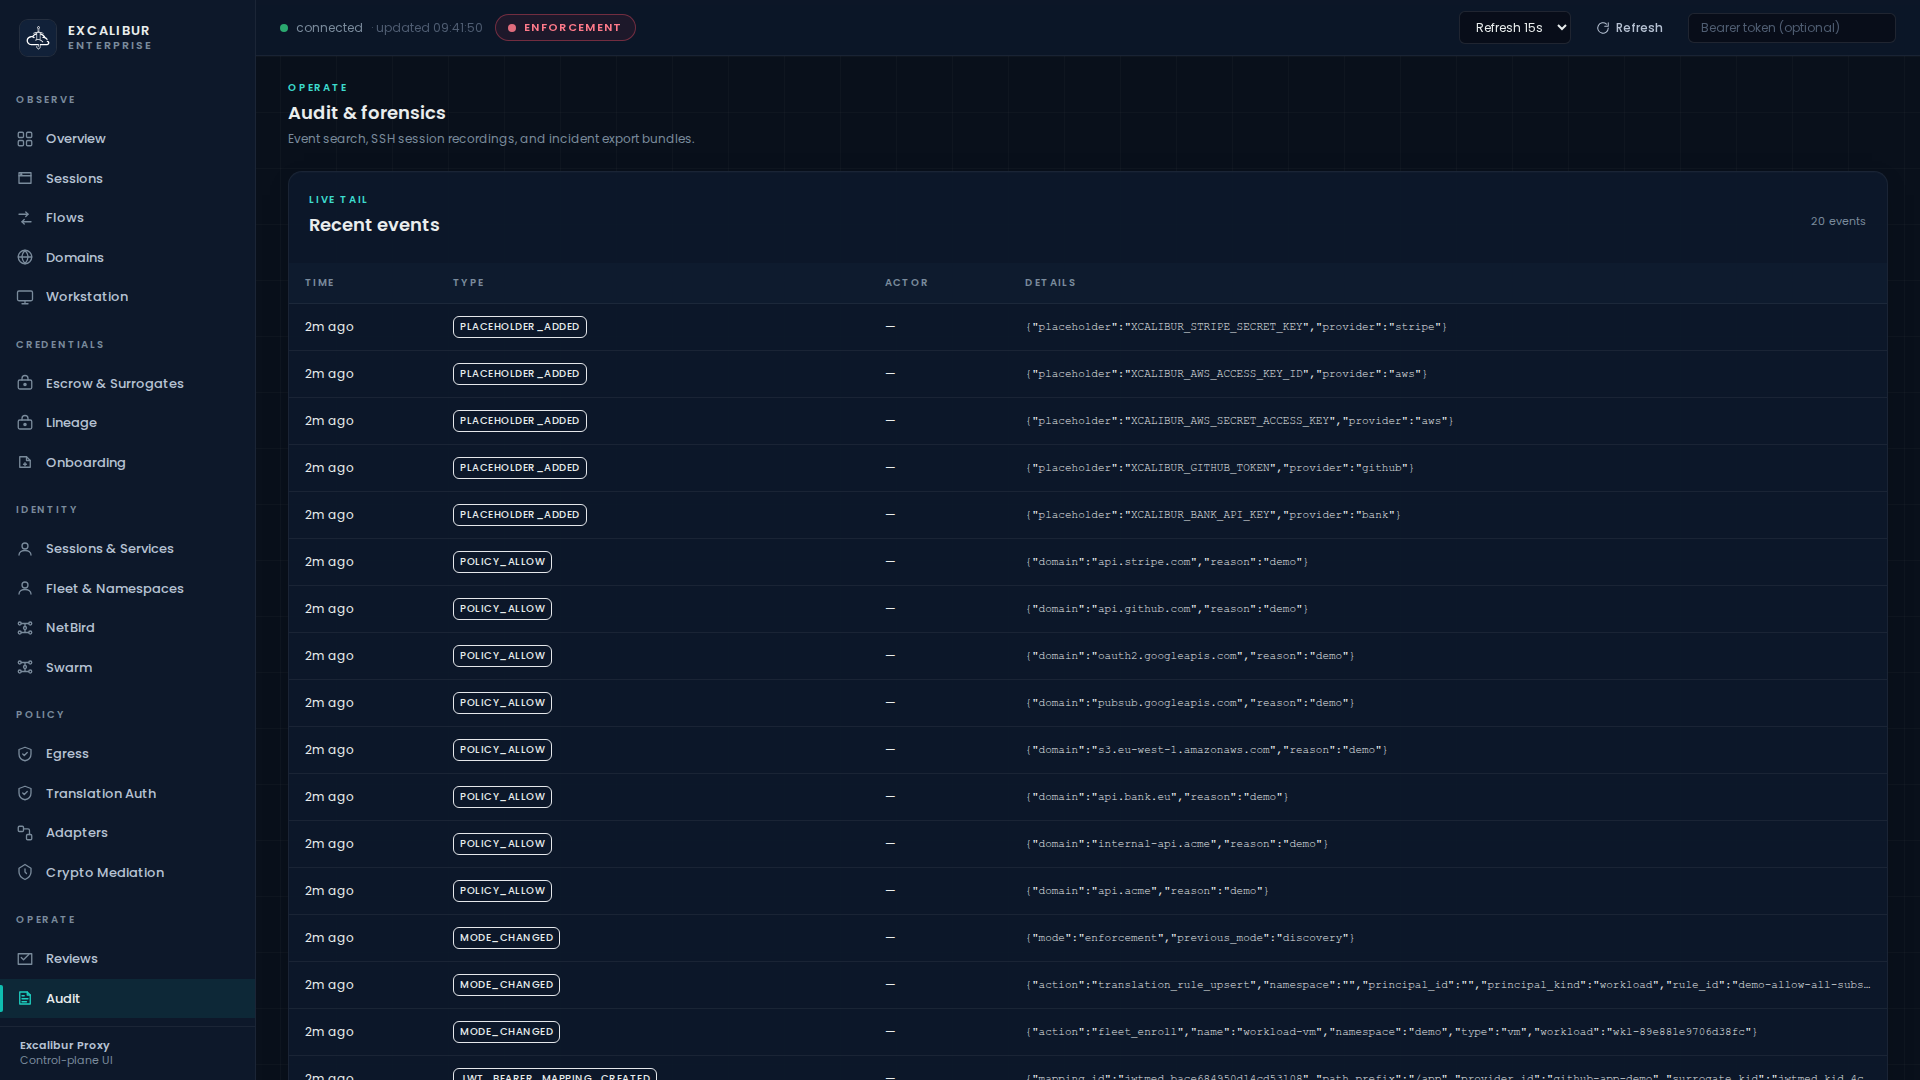
Four sections:
- Recent events live tail with Time, Type, Actor, Details and a Denials only toggle.
- Audit search with query input + Search button.
- SSH session recordings — ID, User, Started, Duration.
- Incident export — session ID input + Export button (returns raw JSON bundle).
| Action | RBAC |
|---|---|
| Live tail, search, export | operator |
Threat & Feeds — /dashboard/threat
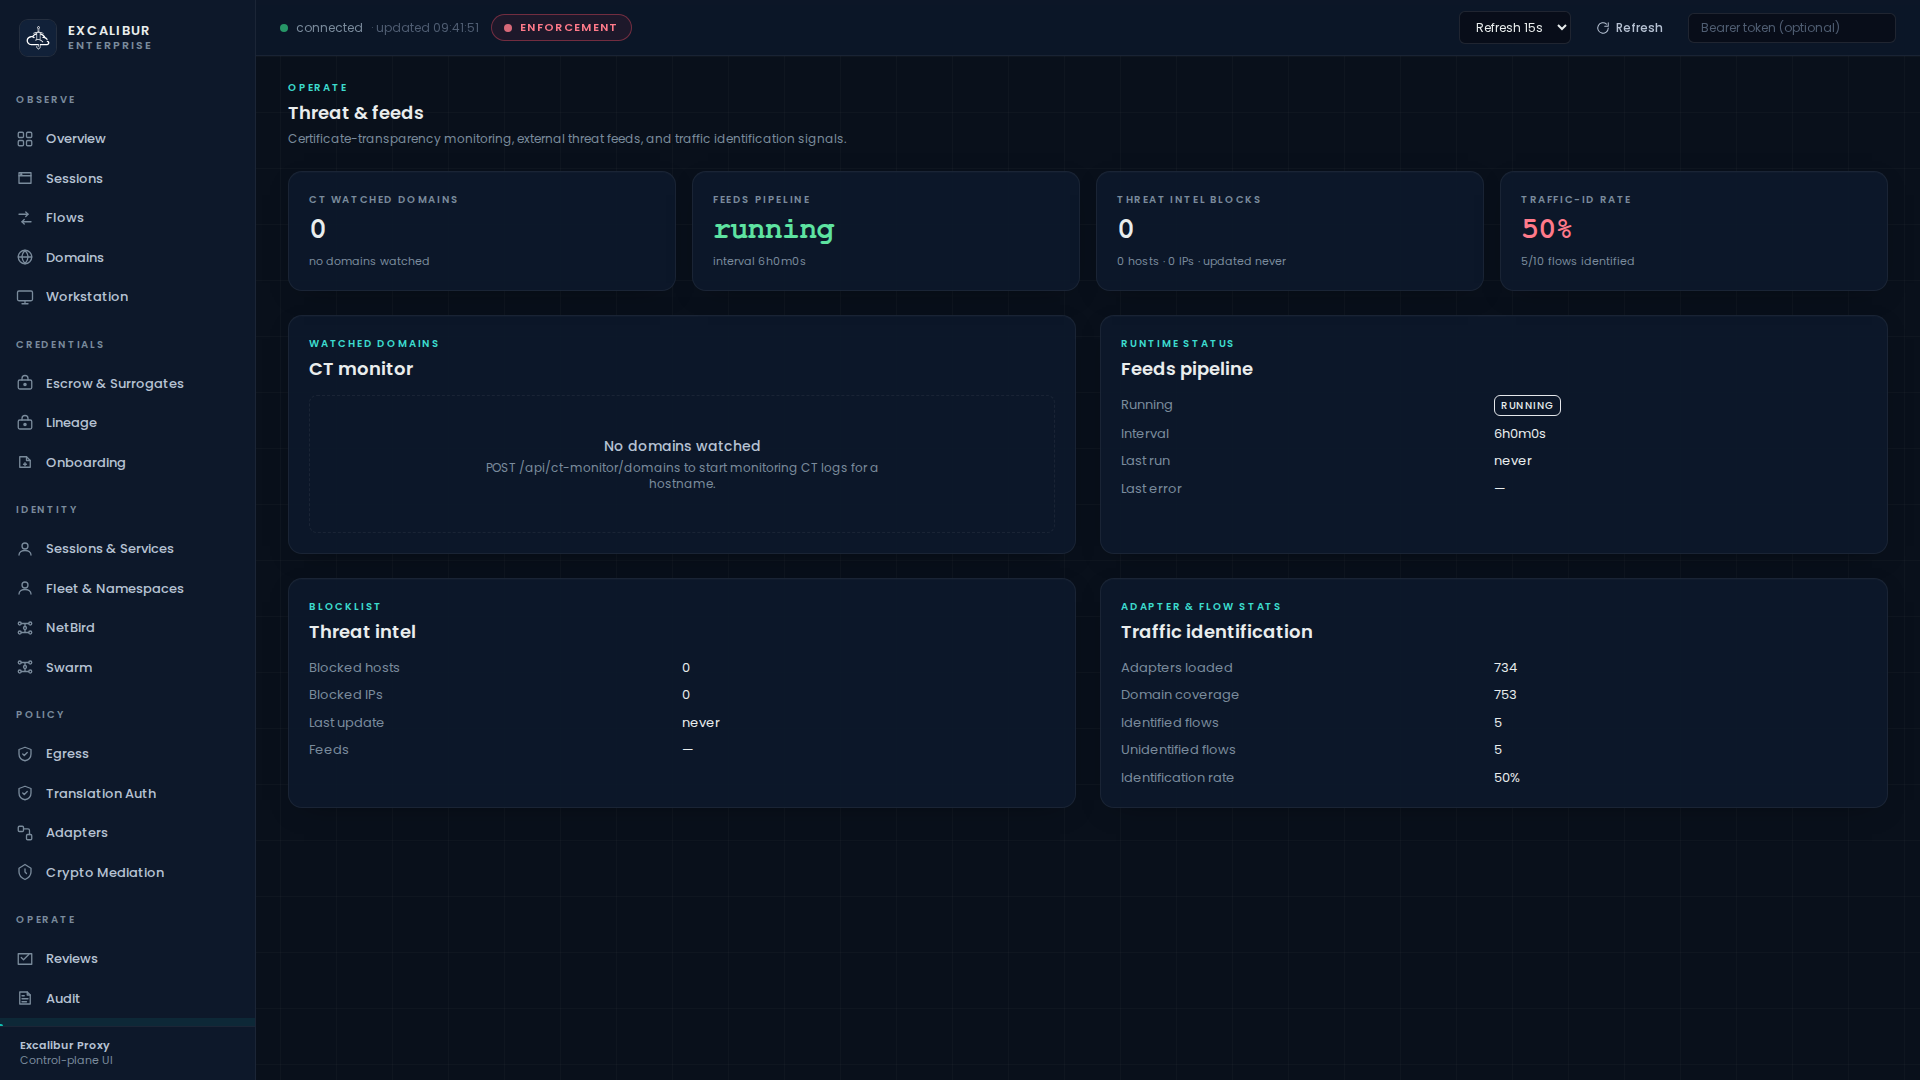
KPI cards (CT watched domains, Feeds pipeline, Threat-intel blocks, Traffic-ID rate) plus four cards: CT monitor, Feeds pipeline, Threat intel blocklist, Traffic identification.
| Action | RBAC |
|---|---|
| CT domains | operator |
| Pipeline / stats / traffic-id | viewer |
Operations — /dashboard/operations
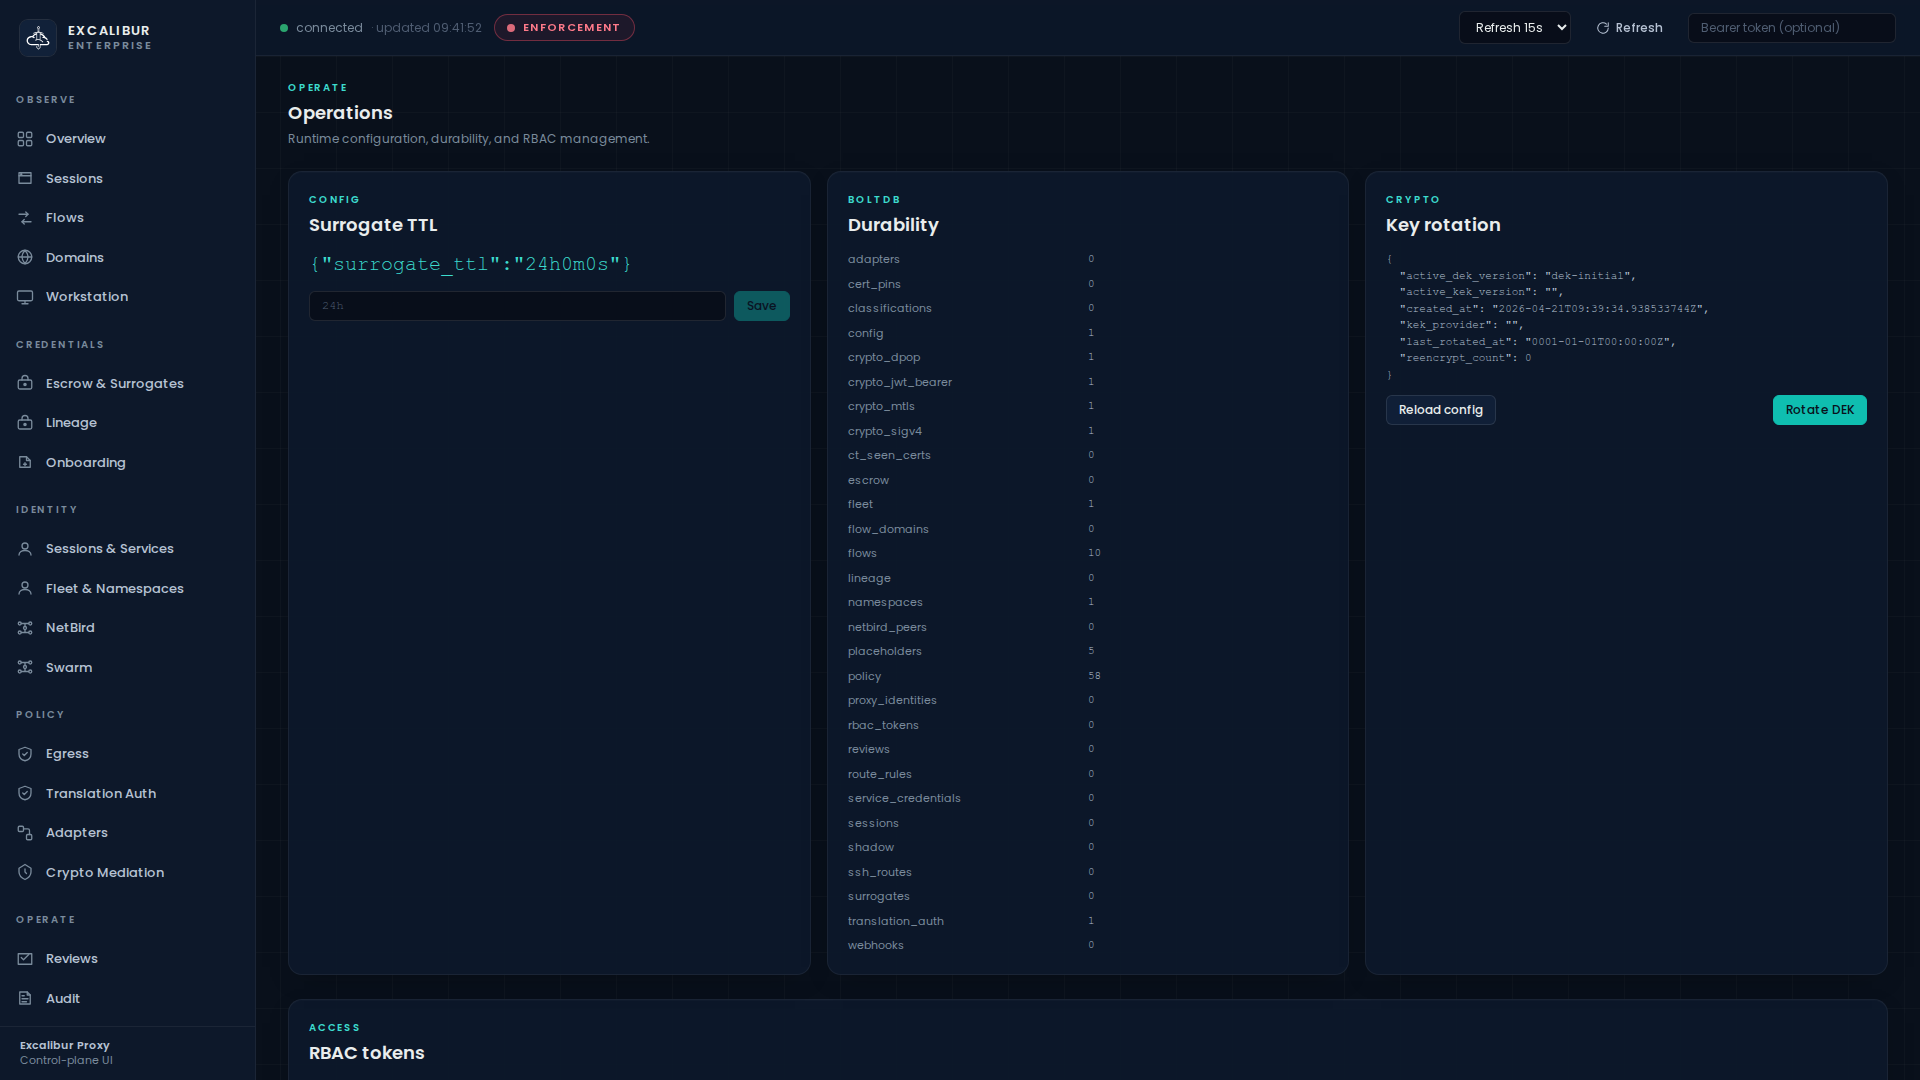
Three cards across the top:
- Surrogate TTL — current value + Save form.
- Durability — internal counters per table.
- Key rotation — JSON status, Reload config + Rotate DEK buttons.
Below: RBAC tokens table with ID, Name, Role, Prefix, Created.
| Action | RBAC |
|---|---|
| Read durability, key rotation | viewer |
| Read surrogate TTL | operator |
| Update surrogate TTL, rotate DEK, reload config, list RBAC tokens | admin |
RBAC roles in one table
| Role | What it can do |
|---|---|
viewer |
Read aggregate stats and health for every page; no per-row inventory of sensitive surfaces, no mutations. |
operator |
Everything viewer can do, plus per-row inventory (sessions, flows, escrow, surrogates, placeholders, etc.) and operator-level mutations. |
admin |
Everything operator can do, plus mode switching, RBAC token management, key rotation, config reload, and any other write action. |
break-glass |
Reserved for emergency access; recorded with a dedicated event class. |